Volume Analysis | Flash Market Update - 7.31.23
CHIEF TECHNICAL ANALYST, BUFF DORMEIER, CMTⓇ
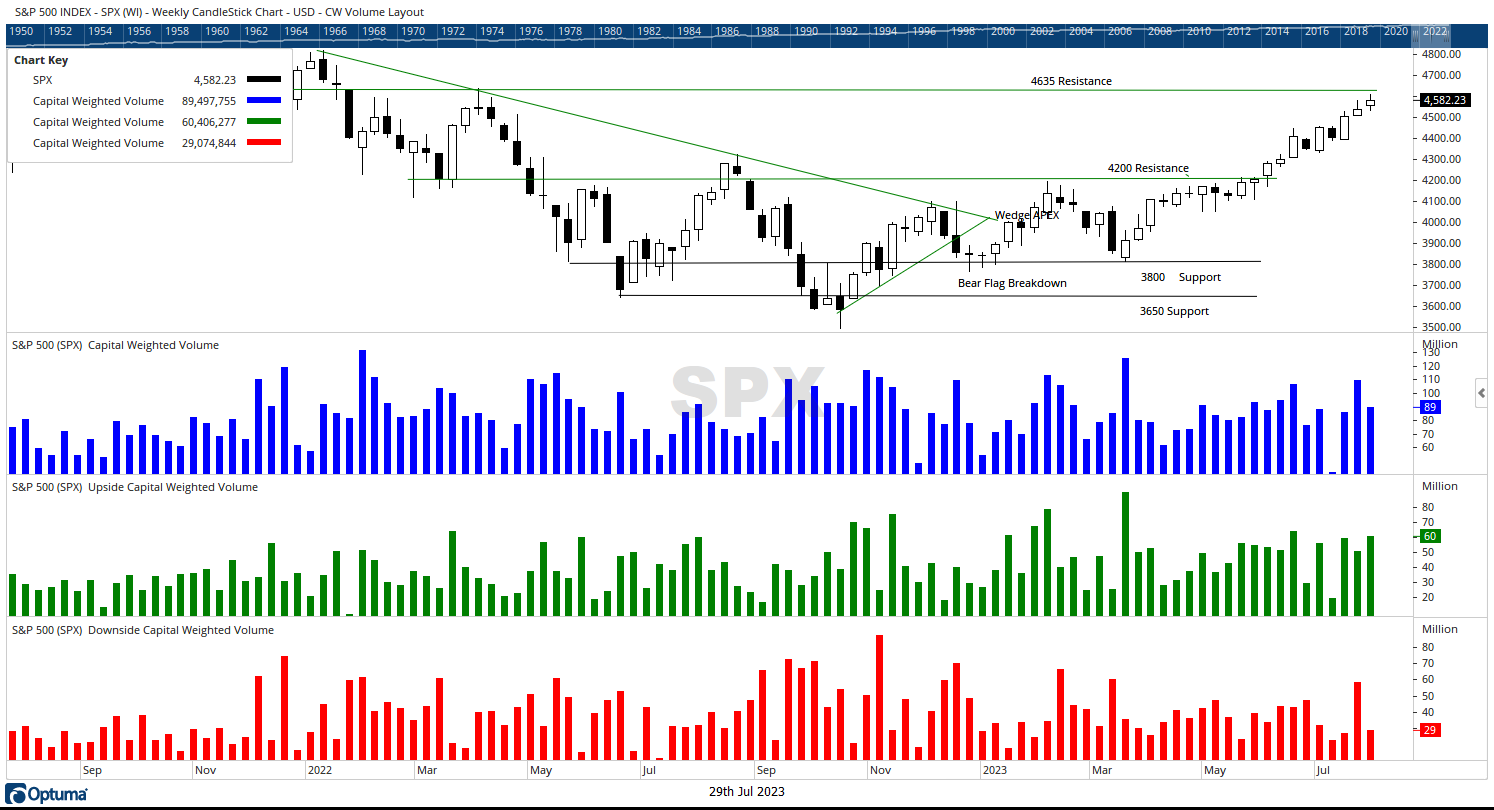
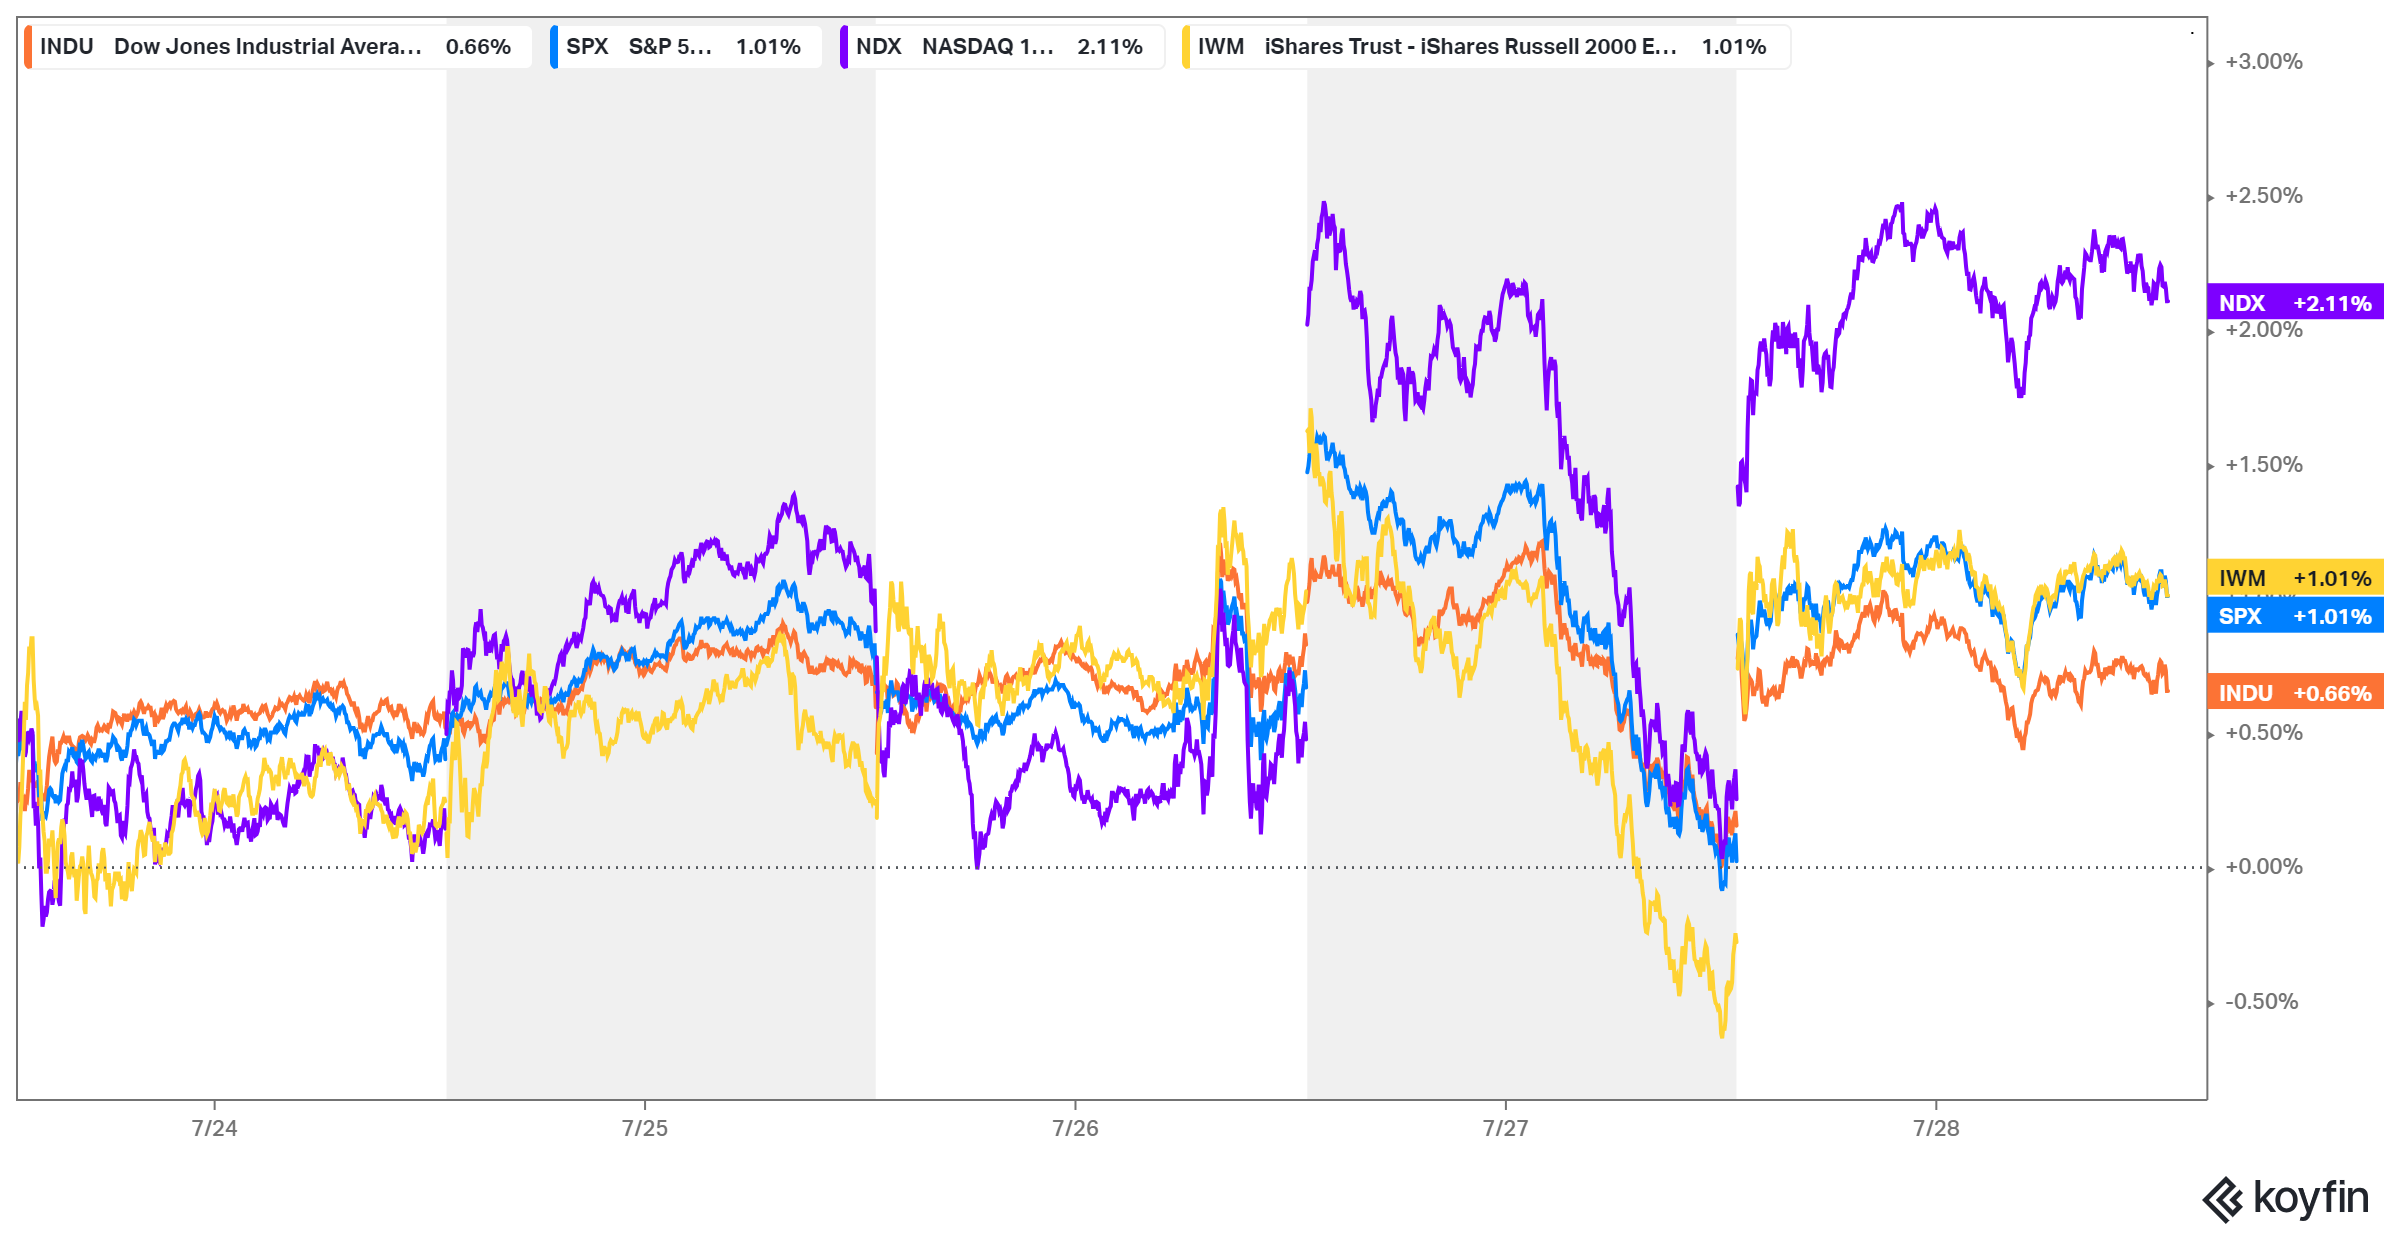
The generals (NDX 100) continued their march up the charts finishing the week up 2.11% as the troops (Russell 2000) followed along hitchin’ a ride. The S&P 500 was up 1.01% with $60.4 billion in inflows with only $29 Billion in outflows. The Russell 2000 like the S&P 500, gained 1.01% on the week.
As a market technician, my role is to assess the market’s vitality with the same precision as evaluating a professional athlete’s performance. Is the market ready to sprint ahead with strength, showing signs of illness, or vulnerable to potential setbacks and injury?
Just like obtaining life insurance involves a thorough examination of one’s health, I employ a sophisticated set of tools to gather data that goes beyond mere opinions and focuses on market participants’ actions. A physical examination, blood work and health records aid insurance companies in determining the insurability of an individual, the data I analyze provides valuable insights into the market’s overall health. By observing and analyzing what market participants are actually doing, I can draw informed conclusions about the market’s condition and potential future trends. This data-driven approach helps build an assessment of the market’s current state, helping me postulate informed opinions.
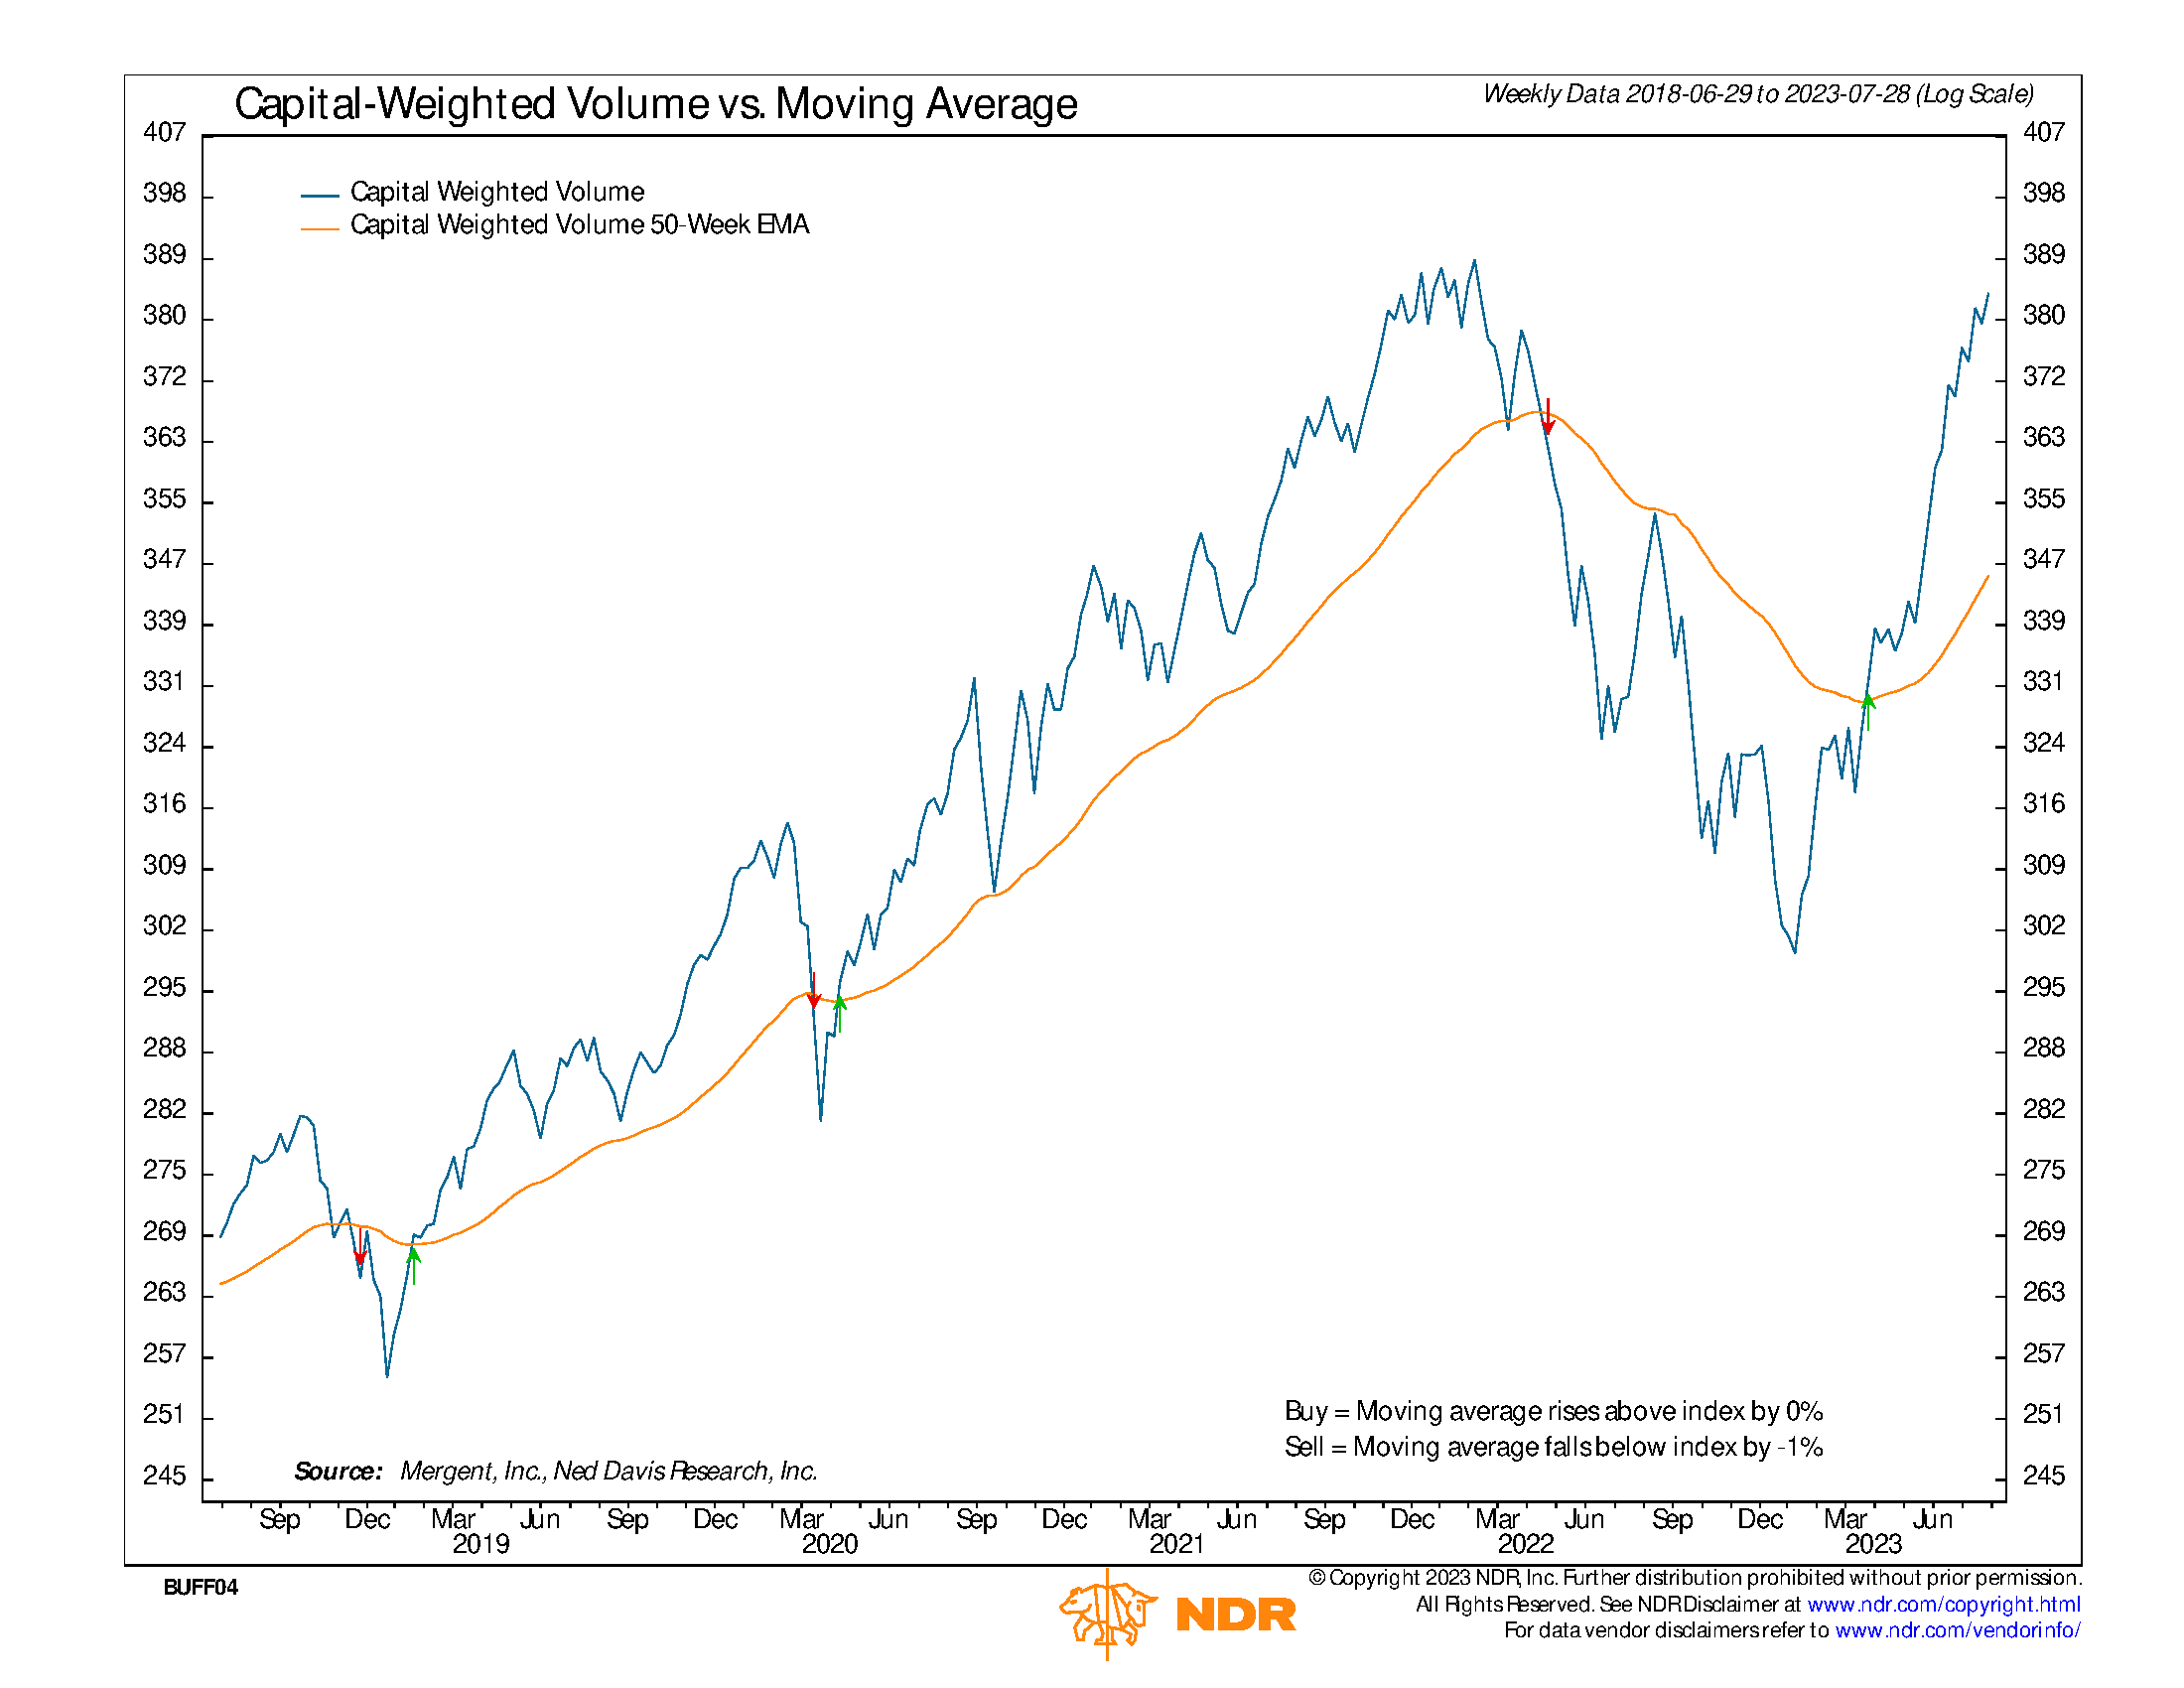
One crucial data point we’ll discuss in this weeks Flash Update is liquidity, measured by Capital-Weighted Volume. By comparing the S&P 500’s up and down volume and tracking net volume over time, we see that Capital-Weighted Volume recently surpassed its yearly highs set two weeks ago. Although the S&P 500 hasn’t yet reached its 2021 highs, capital-weighted volume is approaching all-time high lev5els. This indicates that volume is leading price, a bullish and healthy sign during an uptrend.
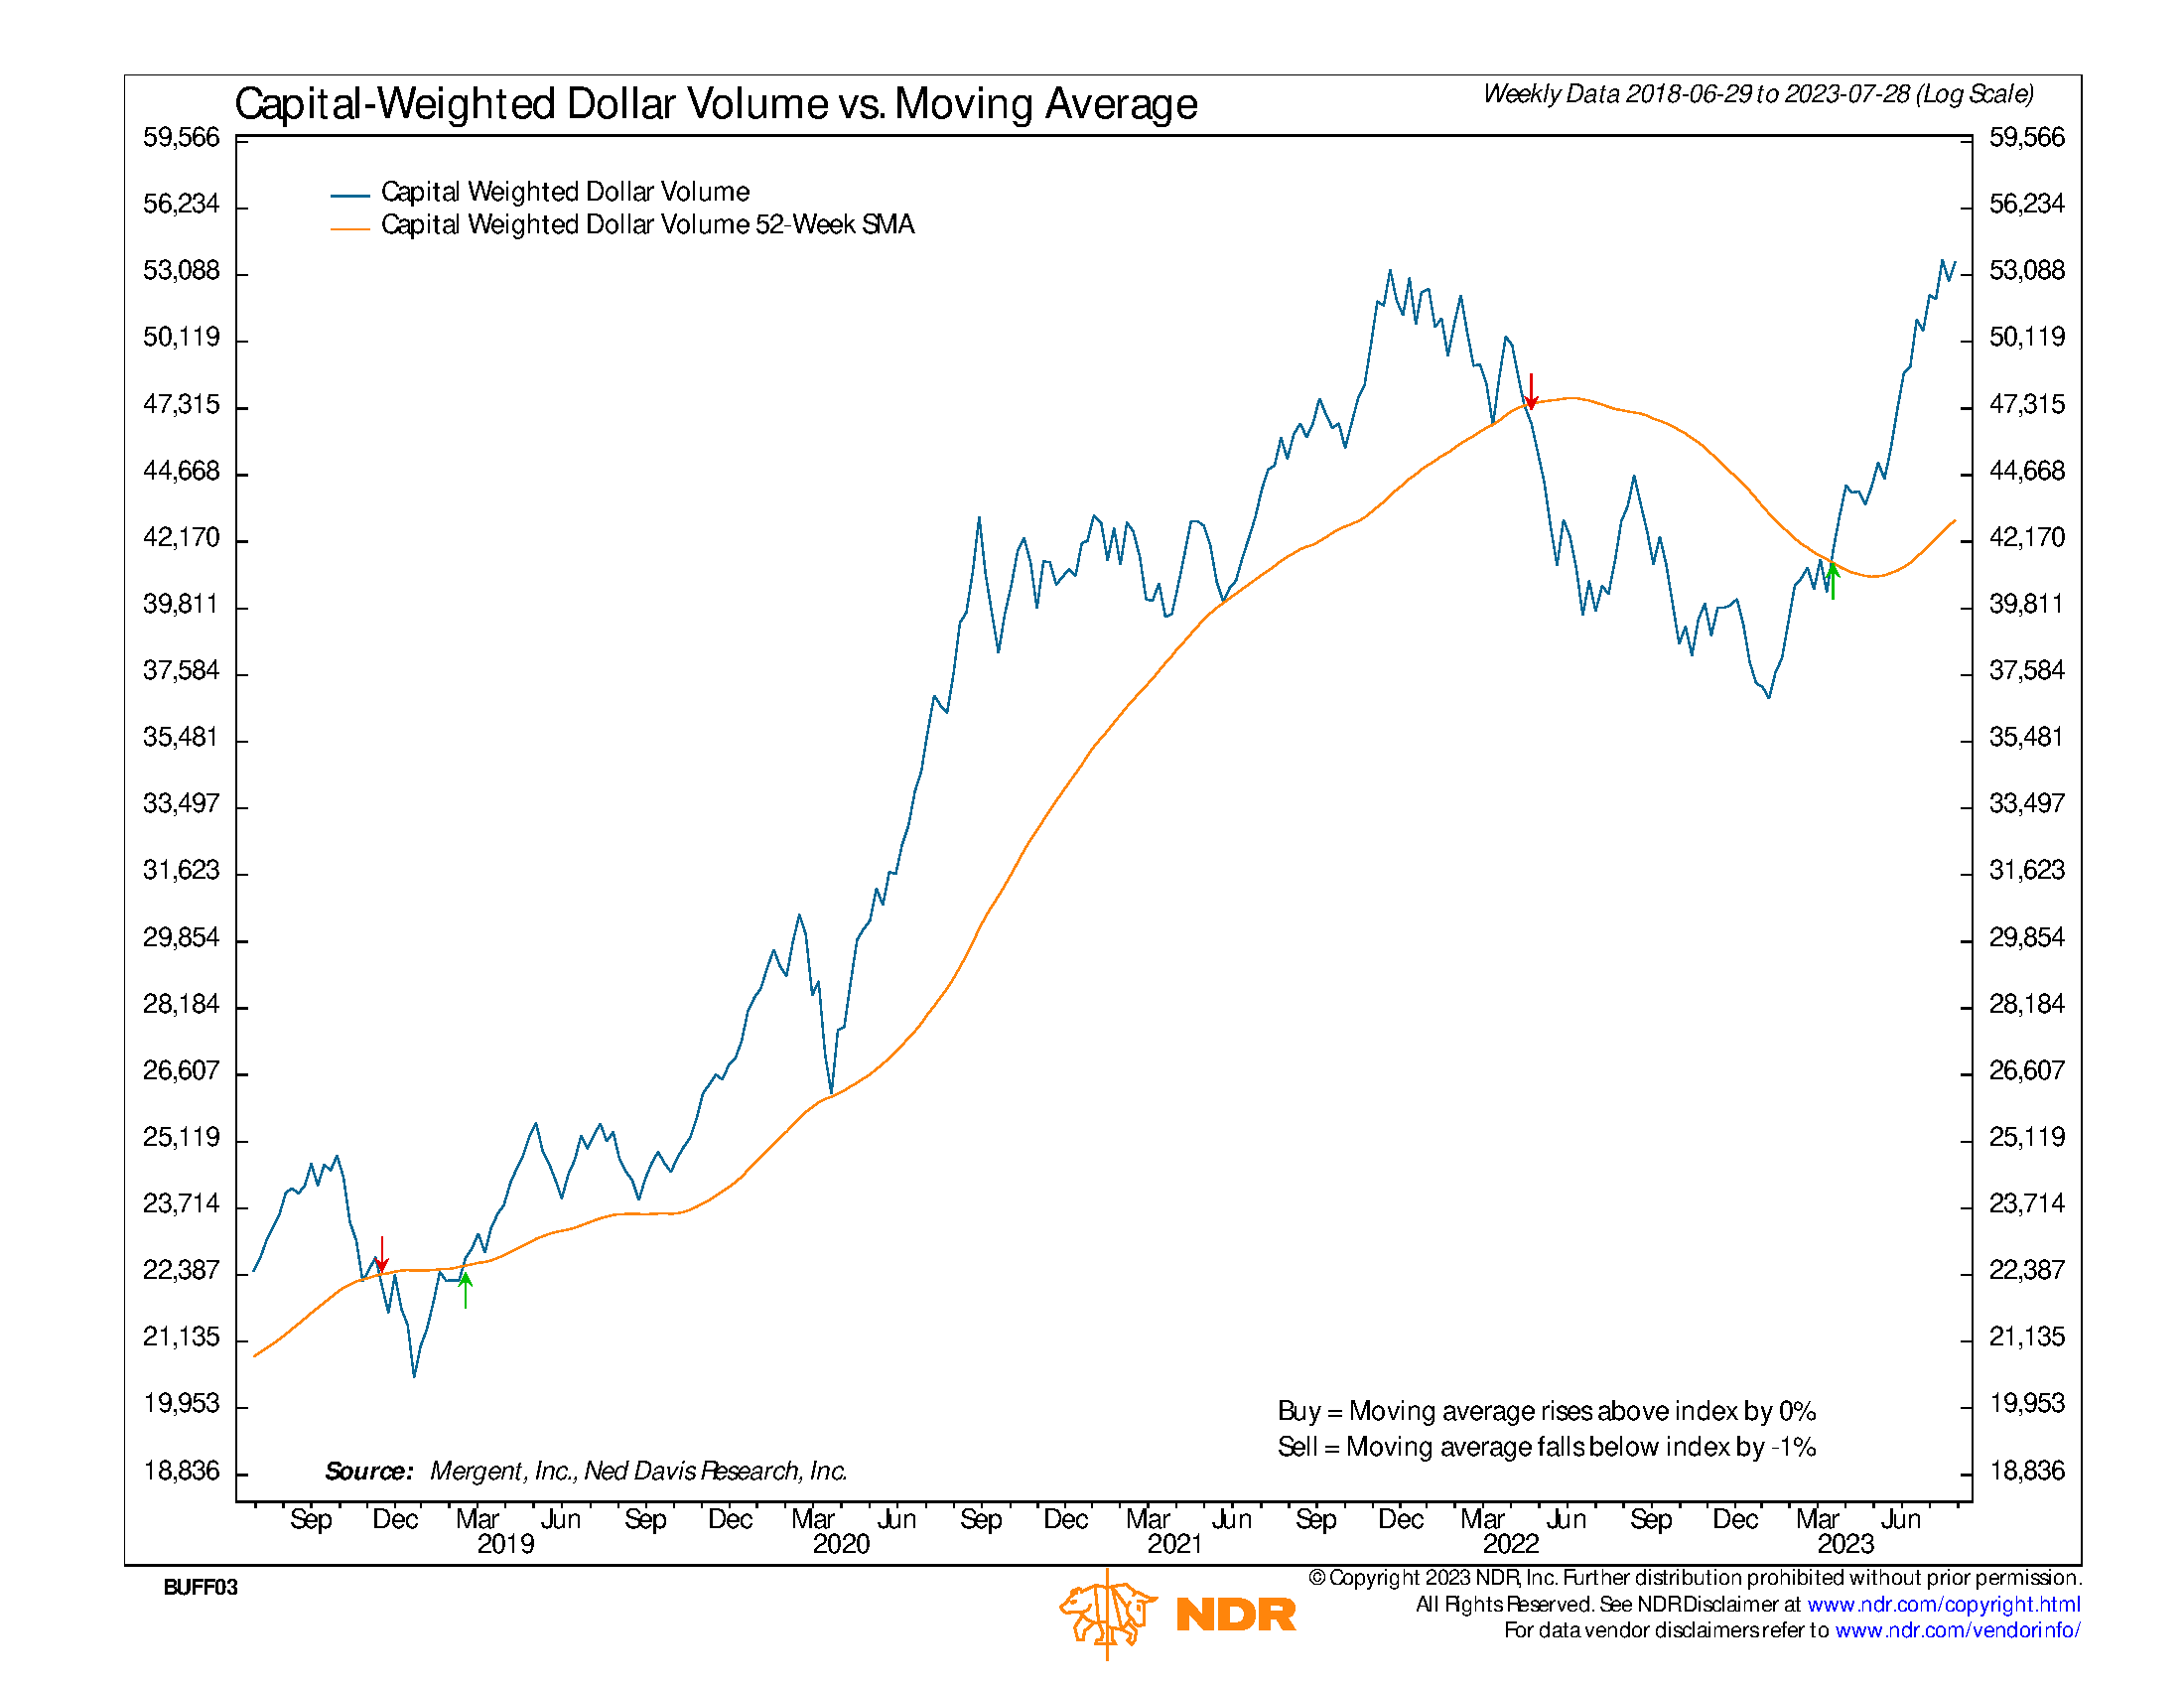
Next, let’s delve into another proprietary indicator: capital flows, also known as Capital Weighted Dollar Volume. This indicator tracks money flowing in and out of the S&P 500. Buying a stock with earned income constitutes capital inflows, while selling a stock in the index without reinvesting represents capital outflows. Currently, Capital Weighted Dollar Volume is on the verge of breaking out to new all-time highs, a very bullish condition as capital flows into the market at a much higher rate than prices are appreciating. However, it also faces strong resistance at the all-time highs. Whether capital flows break out to new highs or take a light pause in the coming weeks, either scenario could indicate a confirmation of the bullish trend.
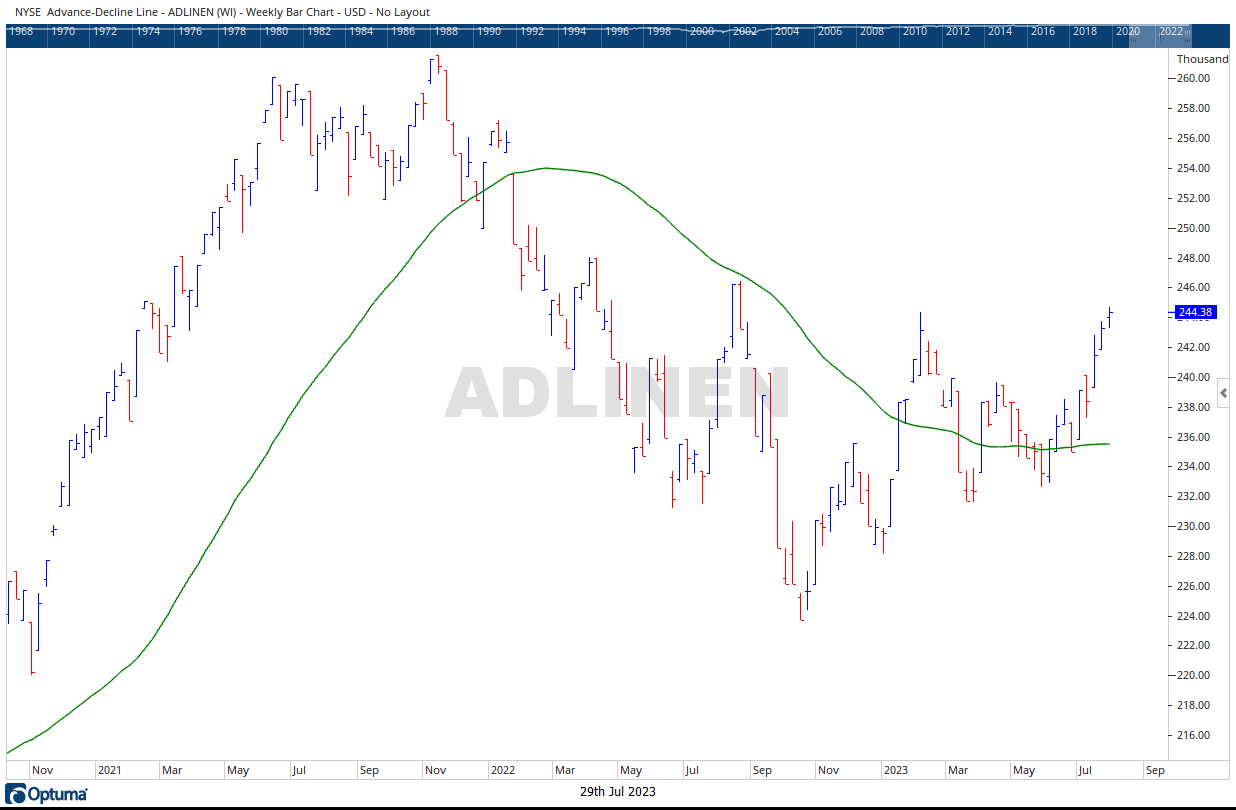
Let’s now consider market breadth through the Advance-Decline line, which tells us how many stocks are participating in the market’s trend. Until recently, this indicator has lagged throughout the year, reflecting the narrow leadership of top Nasdaq stocks (the generals) driving up the S&P 500 while other stocks (the troops) were mostly in retreat. However, recent developments show that the troops are now supporting the generals advance, as evidenced by the AD Line breaking out of a consolidation range.
As the S&P 500 breaks out and approaches the significant resistance level at 4635, we’ve been anticipating this event and are now finally getting close to it. Additionally, the support levels for the S&P 500 are at 4400 and 4200. Encouragingly, our volume indicators have already surpassed their corresponding resistance levels some time ago, leading me to be optimistic that price may eventually follow suit. If the S&P 500 manages to break the 4635 resistance, the next resistance level to watch is 4740.
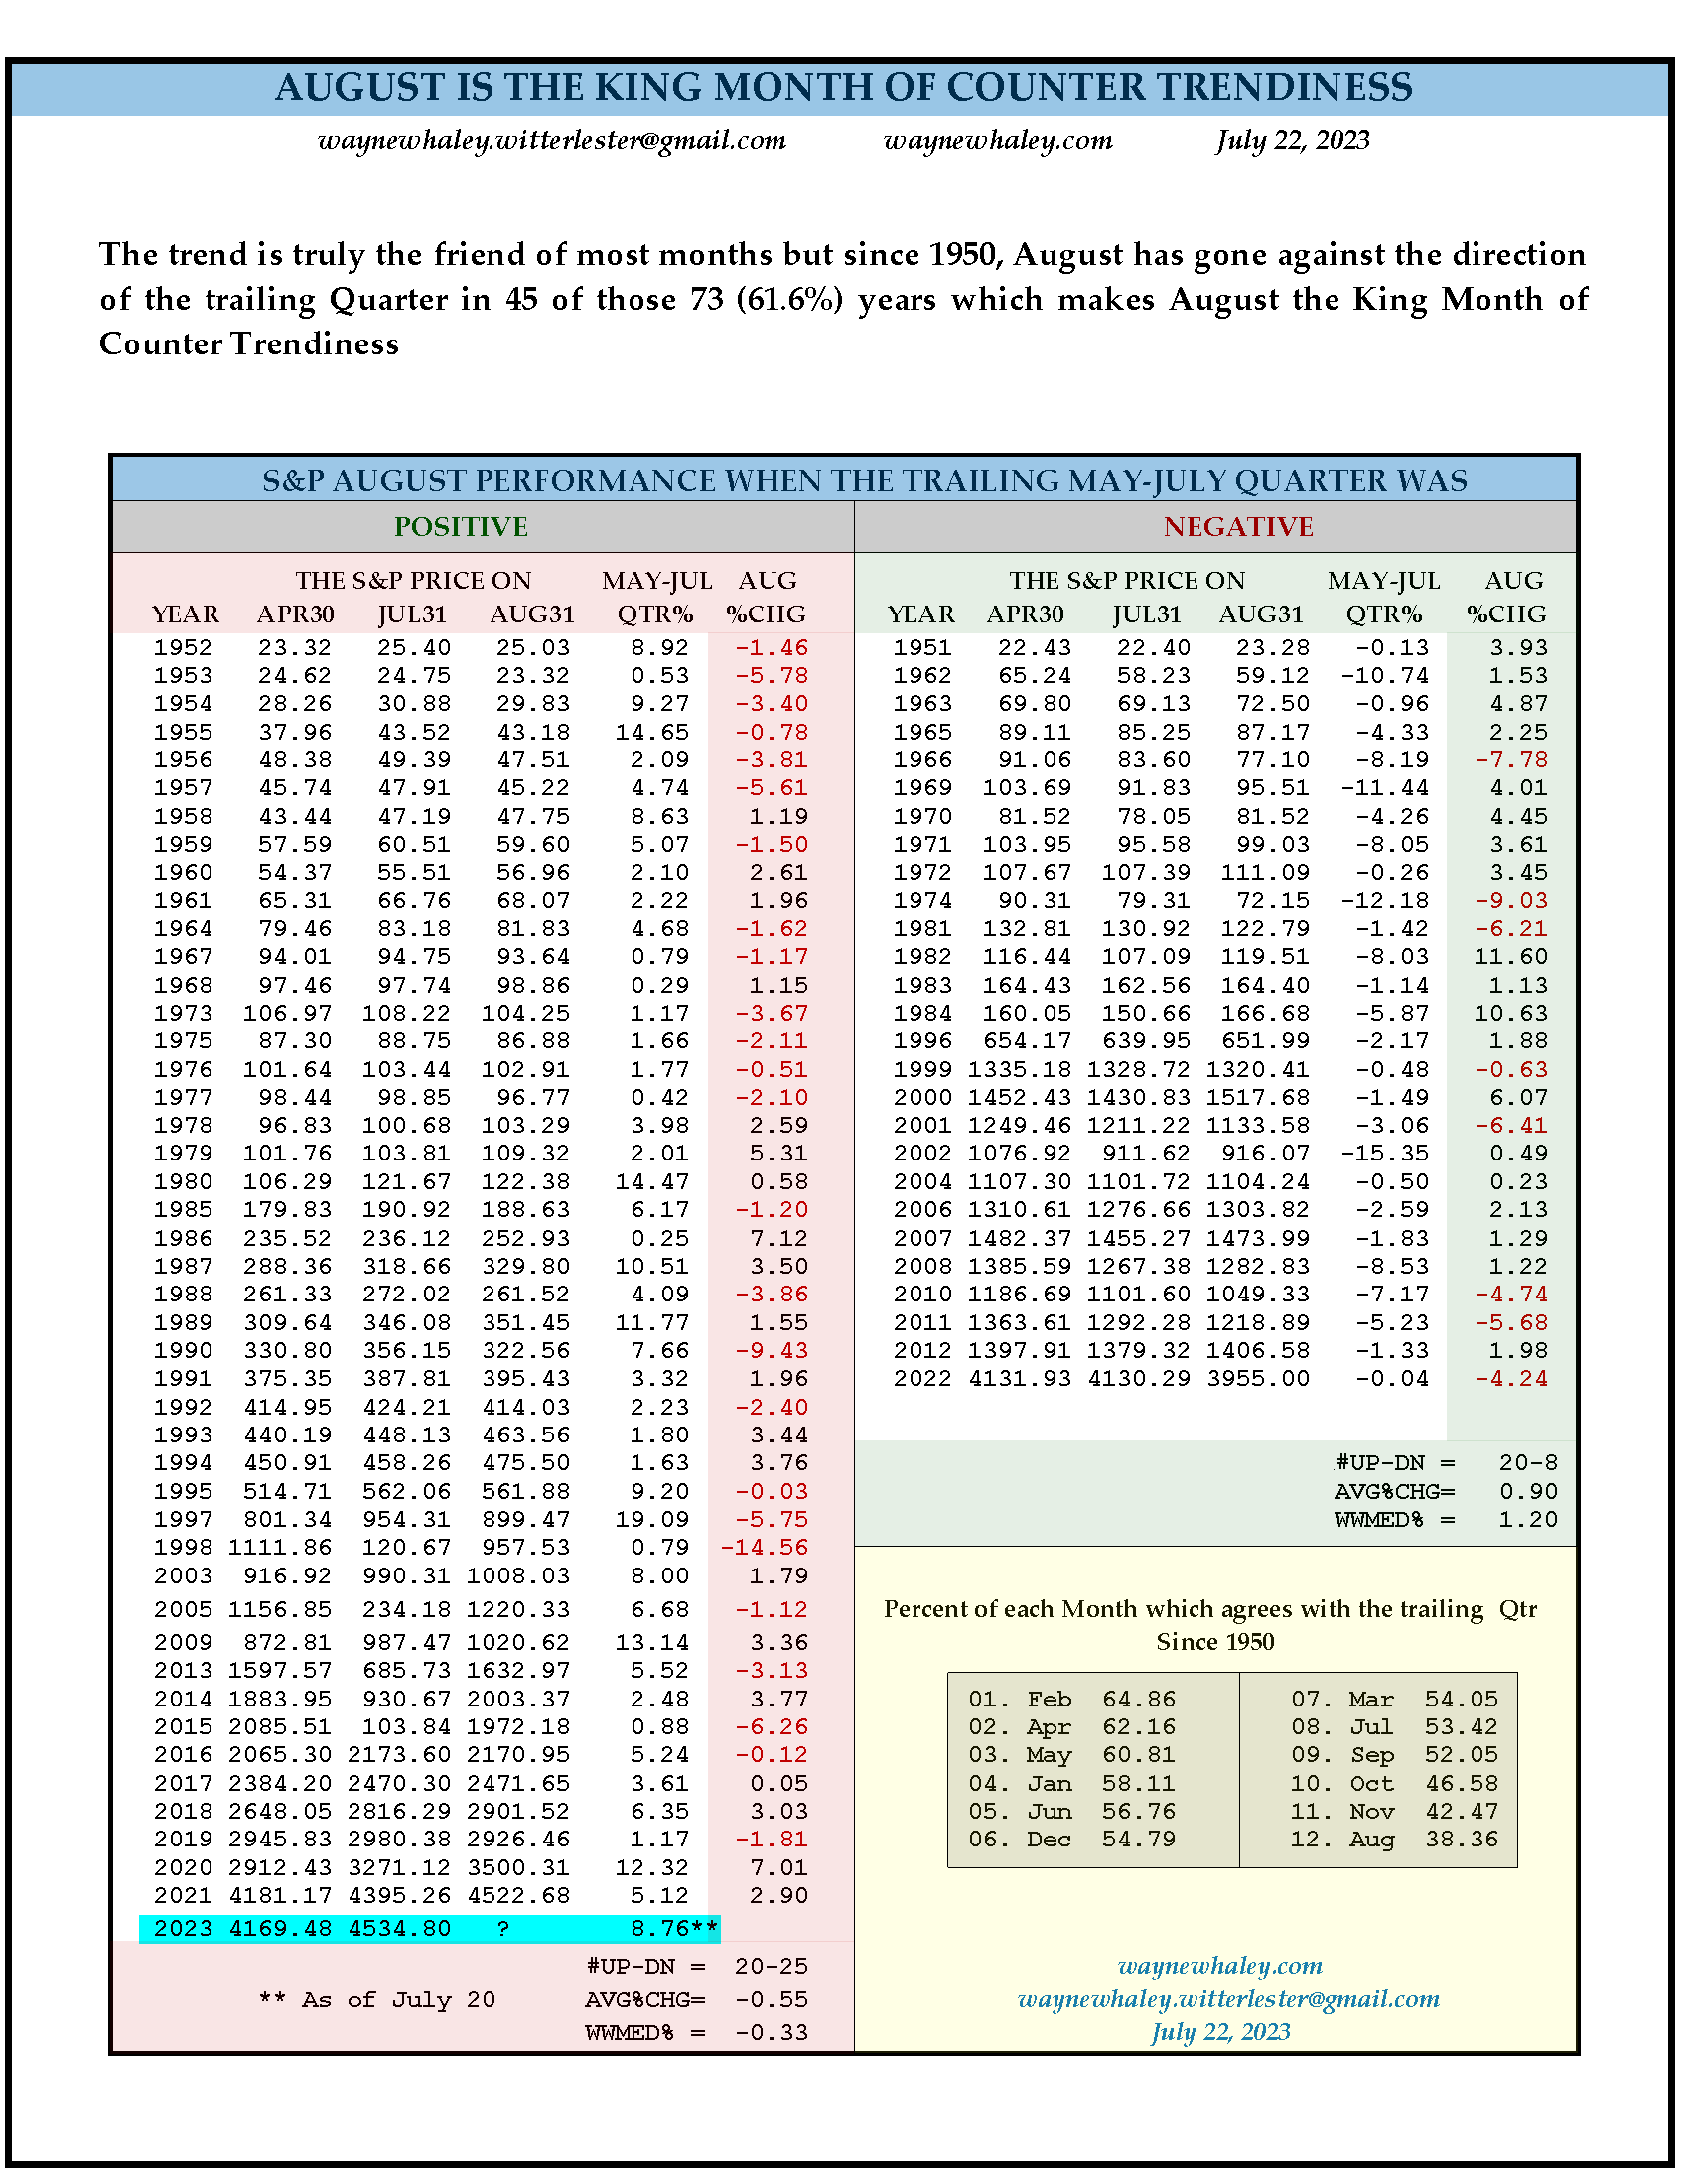
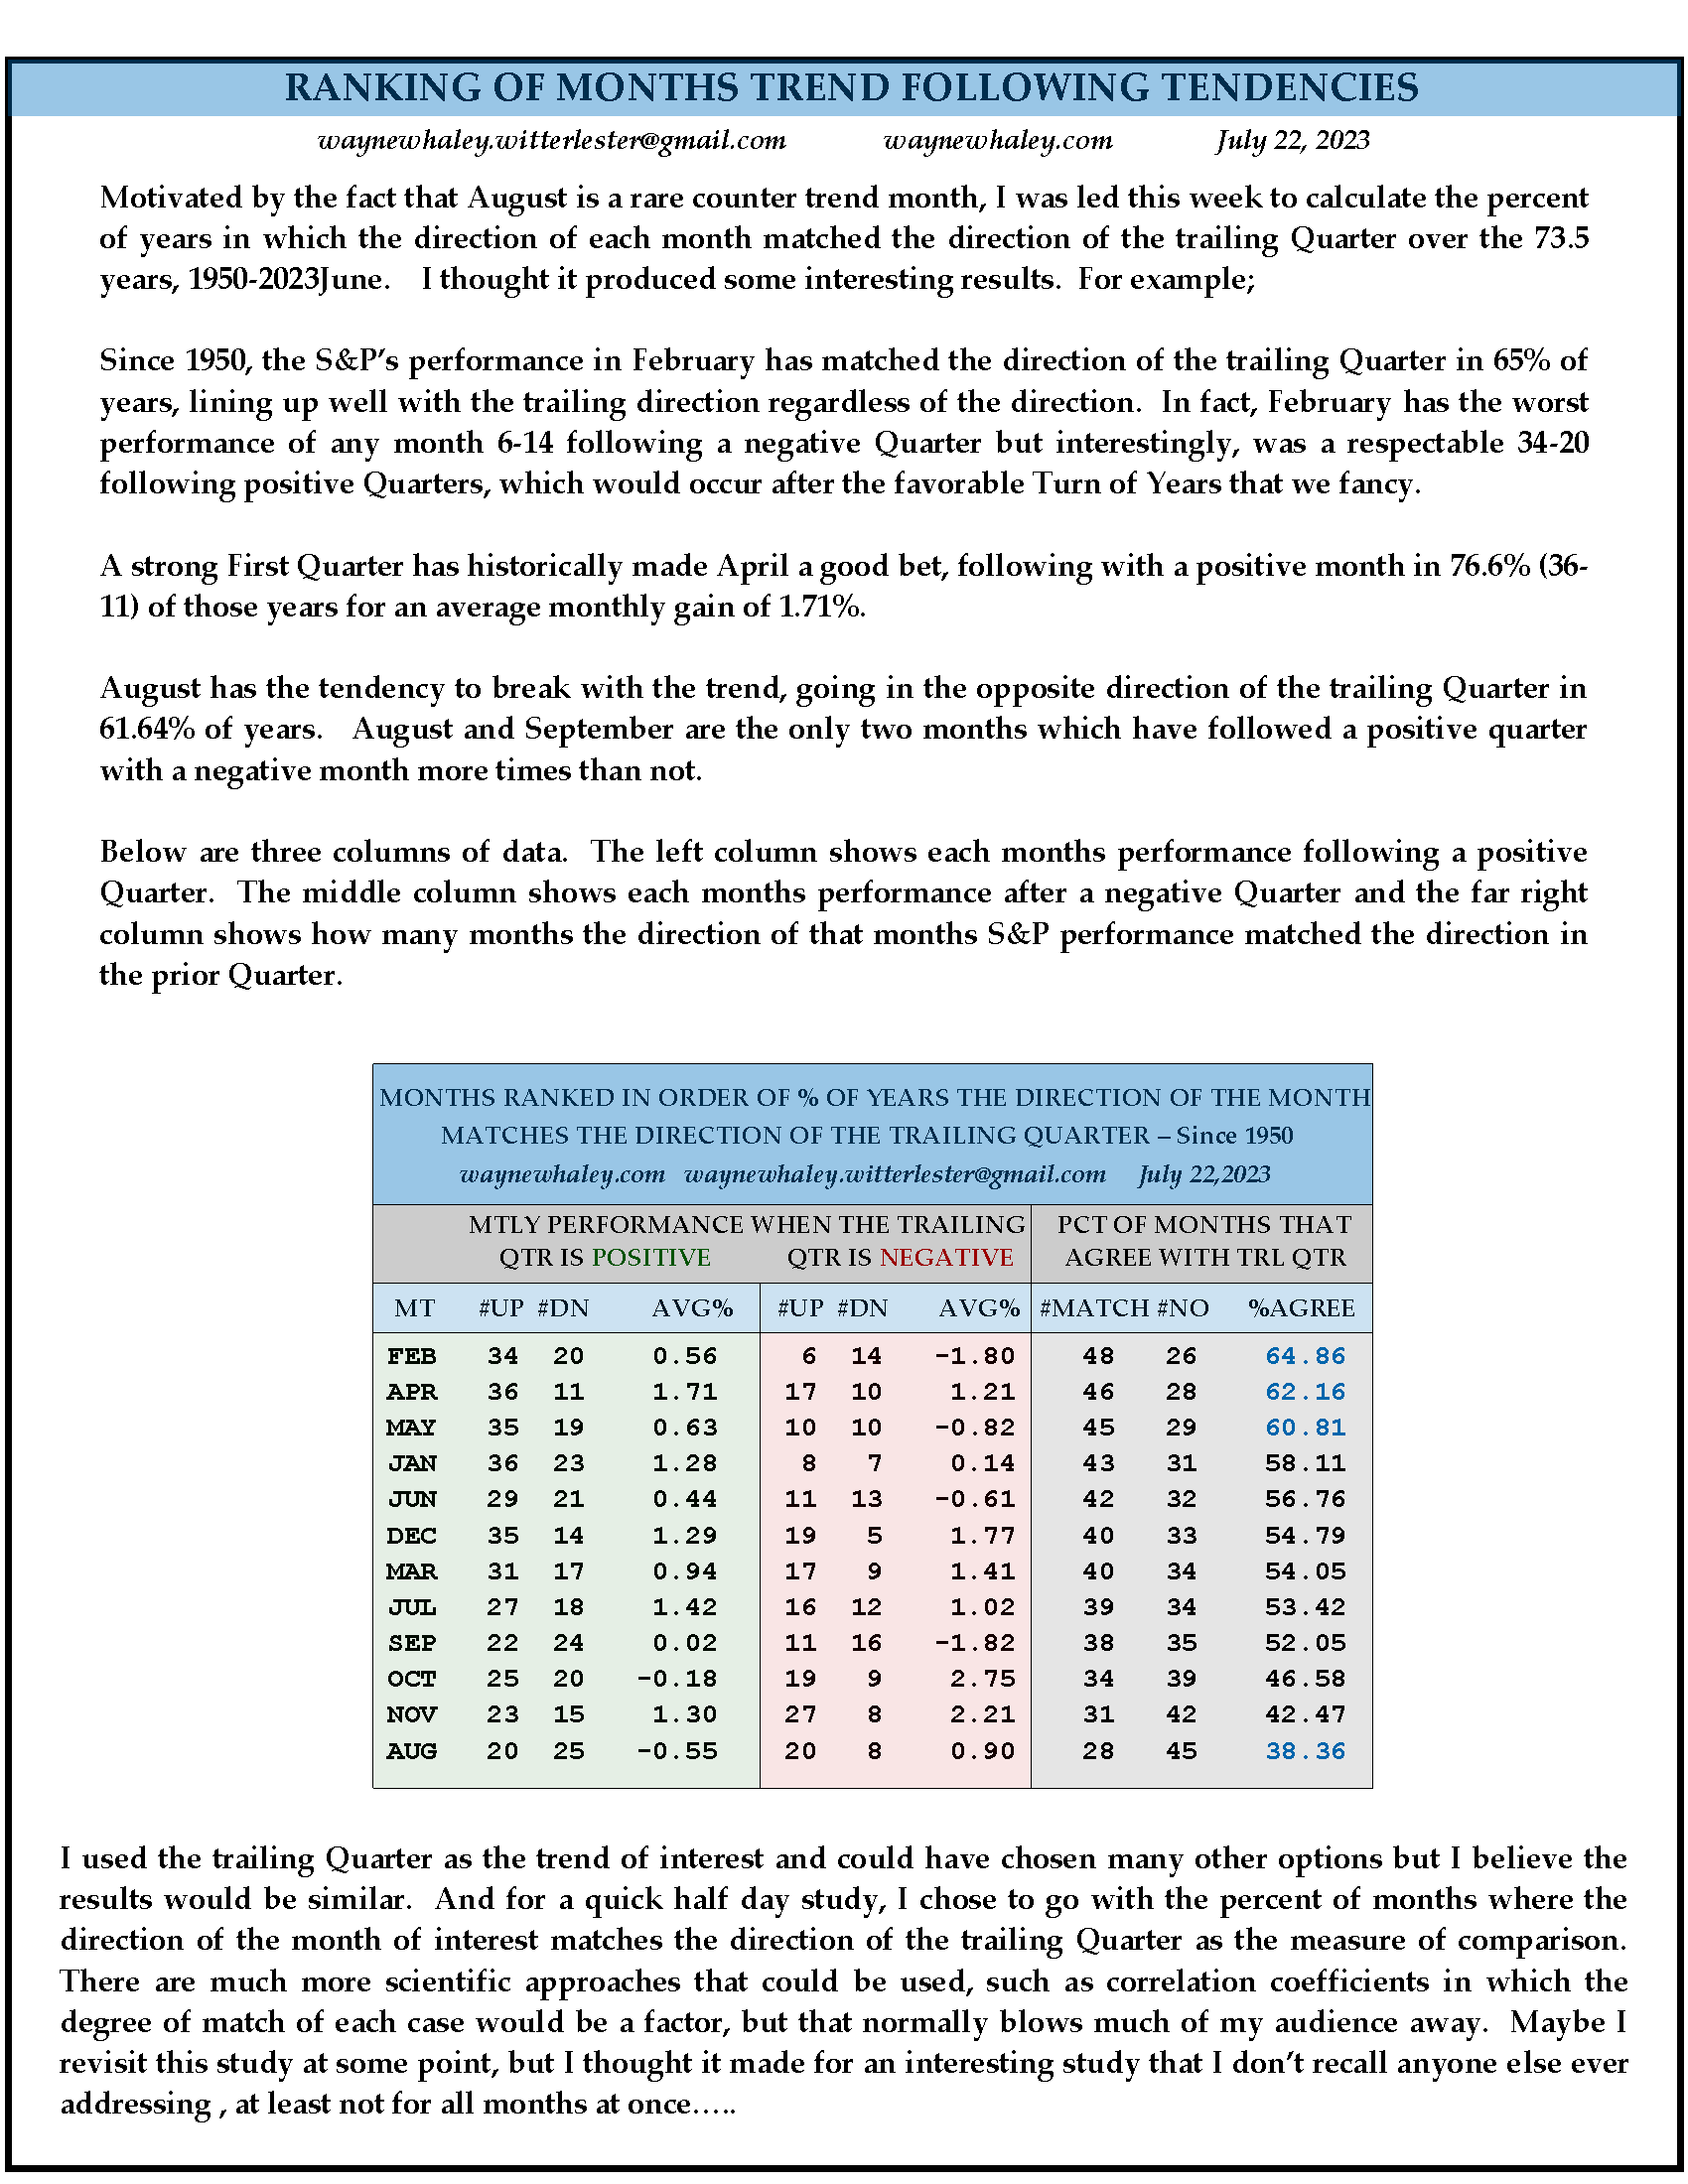
While we remain optimistic, it’s essential to exercise caution during this unique time of seasonal trends. Historically, August is known for reversals, and September tends to be the worst month, the only month with a negative historical return. Research suggests that after a positive quarter, August has a 60% probability of reversing. However, a bullish outlook could involve the generals (NDX 100 or the magnificent 7) taking a pause to refresh while the troops gather strength for a potential assault on all-time highs. So, a light-volume pause over the coming months may not be the worst condition, as it could possibly facilitate a bullish outcome.
In conclusion, the market is showing positive signs, with various indicators pointing towards a healthy uptrend. However, it’s wise to be mindful of historical patterns and maintain a watchful eye on how events unfold in the coming months. Grace and peace my friends,
BUFF DORMEIER, CMT®
Updated: 7/31/2023
Historical references do not assume that any prior market behavior will be duplicated. Past performance does not indicate future results. This material has been prepared by Kingsview Wealth Management, LLC. It is not, and should not, be regarded as investment advice or as a recommendation regarding any particular security or course of action. Opinions expressed herein are current opinions as of the date appearing in this material only. All investments entail risks. There is no guarantee that investment strategies will achieve the desired results under all market conditions and each investor should evaluate their ability to invest for the long term. Investment advisory services offered through Kingsview Wealth Management, LLC (“KWM”), an SEC Registered Investment Adviser.
