Volume Analysis | Flash Market Update - 10.10.22
Last week the market started off with a massive surge the first two days of the new month, only to give the majority of the gains back at the end of the week. So, has the market finally reached a capitulation point or is there more damage to be done? This is the difficult question we now are left pondering.
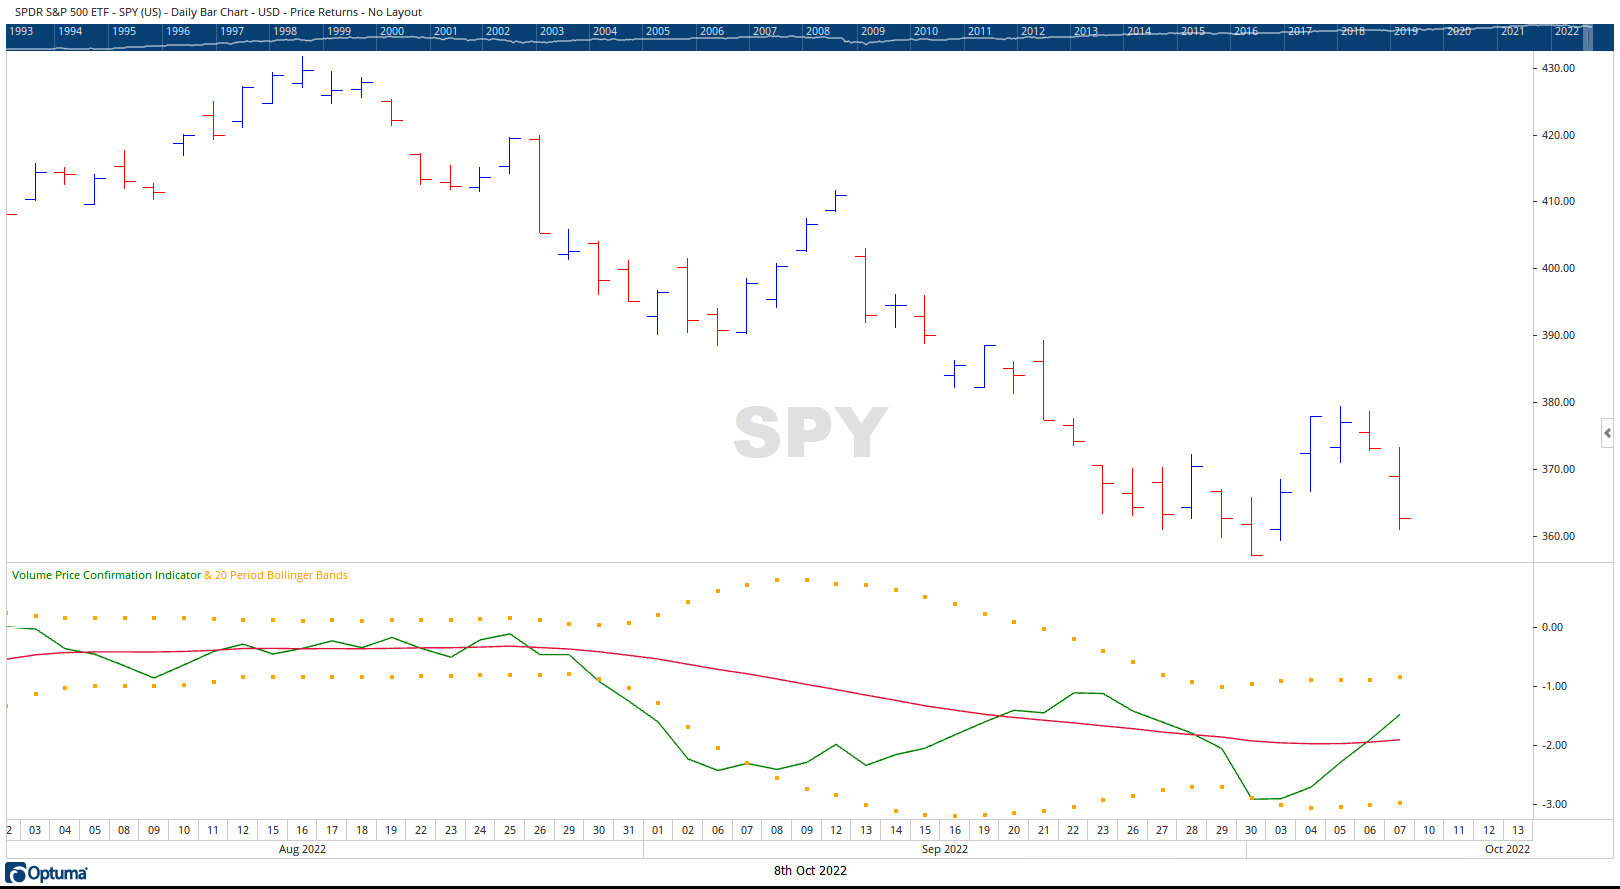
As noted last week in “Returning to Orbit Part IV”, on Friday, September 30th, the VPCI finally met its lower standard deviation band but has not yet reached the -4 oversold level. Once the S&P 500 has fallen over 10%, an official Volume Price Confirmation Indicator (VPCI) capitulation bottom signal requires three ingredients to be present. First, the VPCI must have previously fallen below its second lower standard deviation band. Two, the VPCI must be below -4. Third, the VPCI has to then rise above and cross over the lower standard deviation band. The last week of September ended with two out of three criteria being met, conditions 1 & 3 (Figure 1). And as evident by the surge Monday and strong follow through on Tuesday, “Two Out of Three Ain’t Bad”. However, the second criteria, was close but just shy of the necessary requirement (-4) with the VPCI closing the last day of month at -3. With such a close call like this, it is difficult to assess whether the equity markets have fully succumbed to capitulation pressures or if there may be still more hardship ahead.
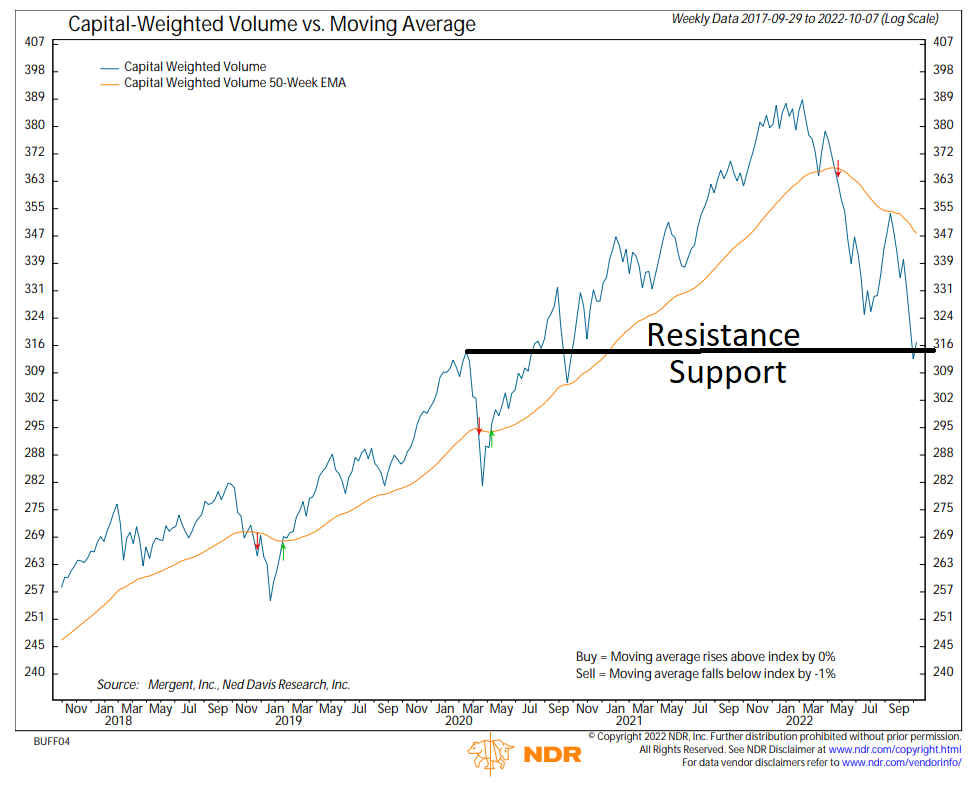
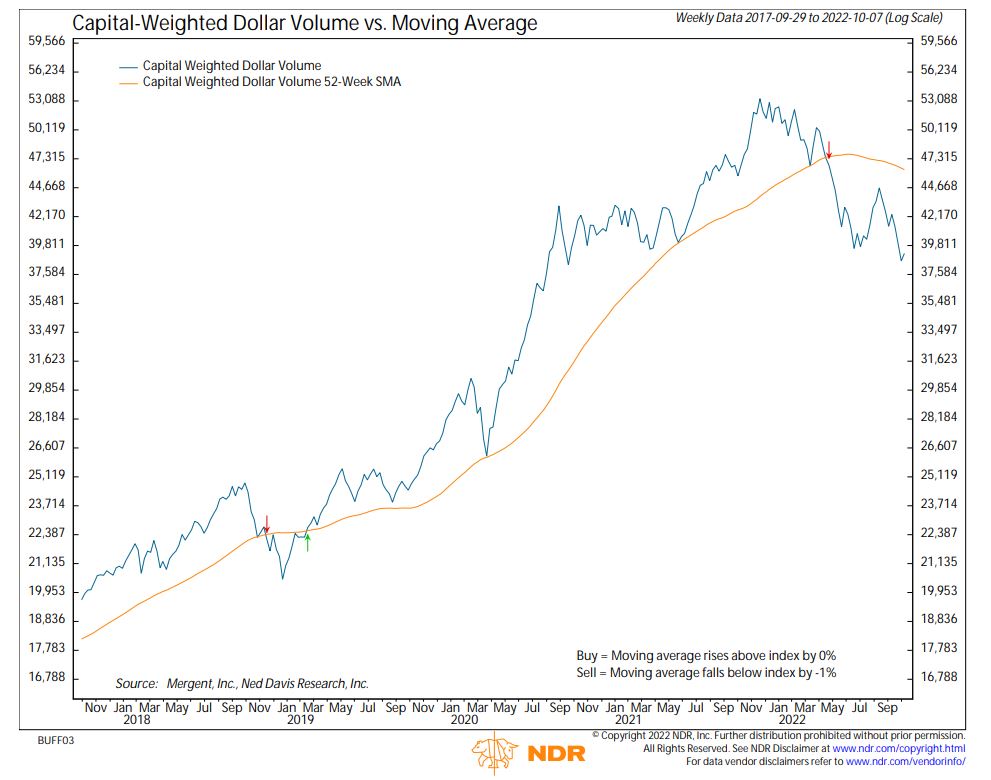
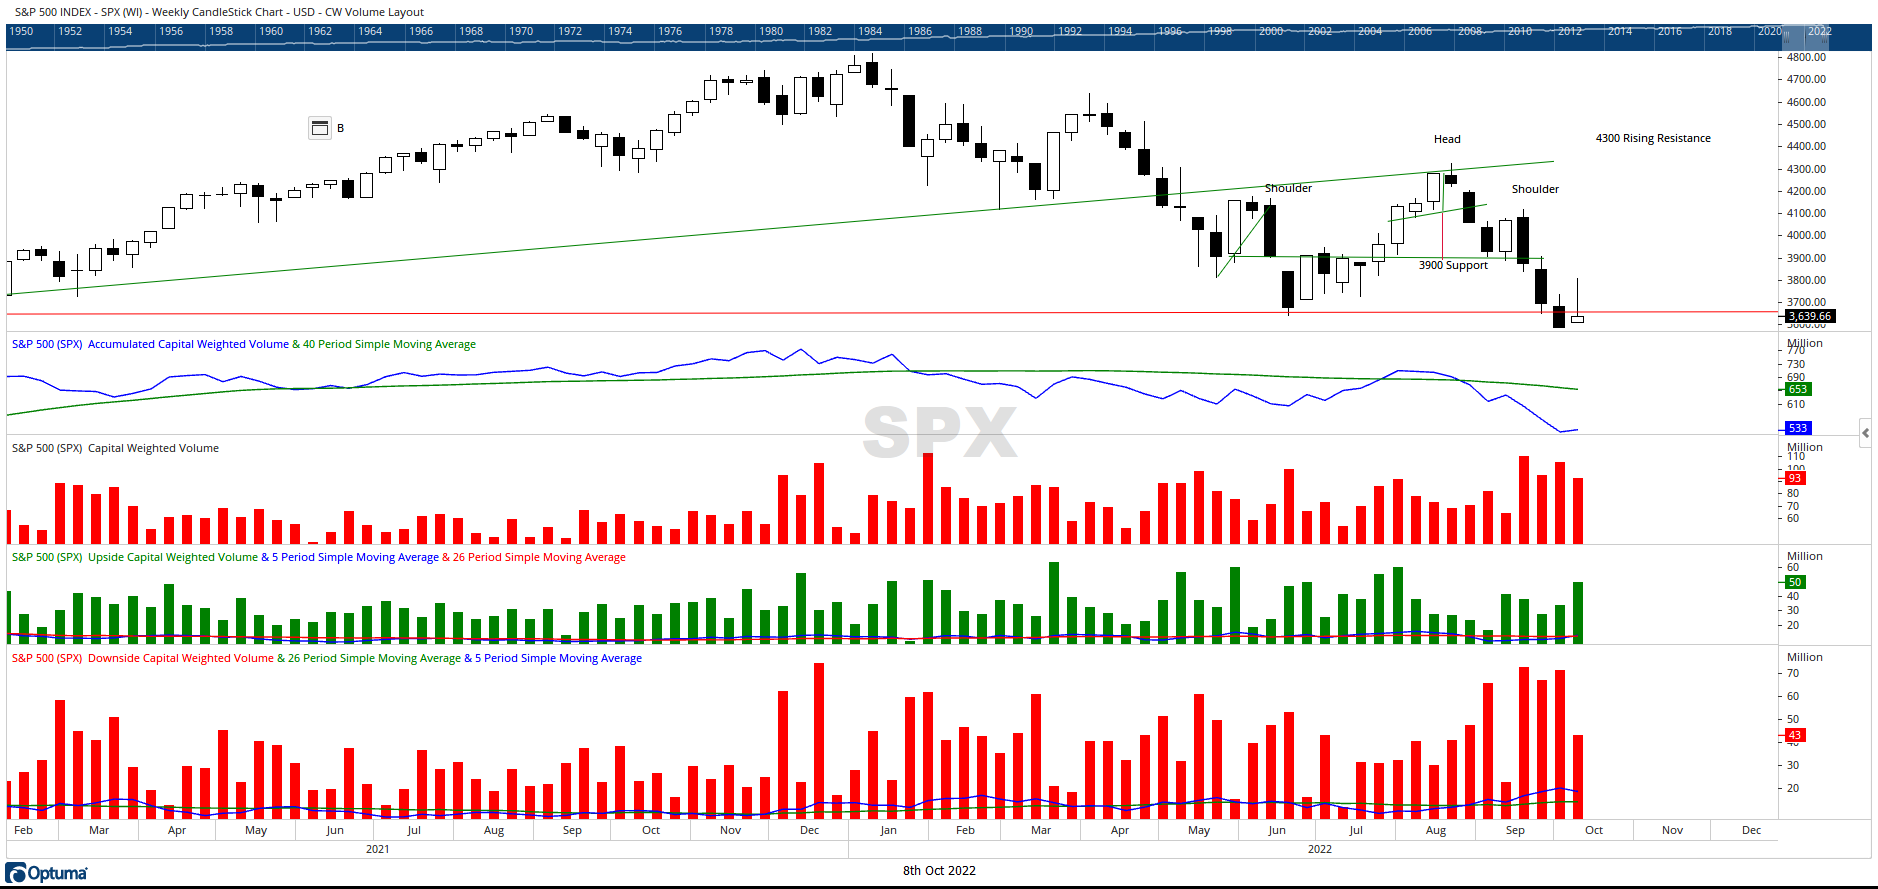
Correspondingly, volume analysis is also teetering at important pivot point levels. The S&P 500’s Capital Weighted Volume closed right at 316 resistance (Figure 2). Meanwhile, S&P 500 Capital Flows, closed just under 39,811 resistance (Figure 3). Similar to last week’s price action, both Capital Weighted Volume and Capital Weighted Dollar Volume closed the week slightly higher. Specifically, there were $4.98 billion in inflows versus $4.28 billion in outflows (Figure 4). Often, when this close to the fulcrum point, the prudent move is not to bet on the future direction but rather patiently await and accept the eventual outcome. In S&P 500 terms, the lines in the sand for price is 3600 support / 3900 resistance, capital weighted volume 316 support / 339 Resistance, and Capital Flows 37,584 support/ 44,668 resistance.


Updated: 10/10/2022
Historical references do not assume that any prior market behavior will be duplicated. Past performance does not indicate future results. This material has been prepared by Kingsview Wealth Management, LLC. It is not, and should not, be regarded as investment advice or as a recommendation regarding any particular security or course of action. Opinions expressed herein are current opinions as of the date appearing in this material only. All investments entail risks. There is no guarantee that investment strategies will achieve the desired results under all market conditions and each investor should evaluate their ability to invest for the long term. Investment advisory services offered through Kingsview Wealth Management, LLC (“KWM”), an SEC Registered Investment Adviser.
