Volume Analysis | 5.11.21

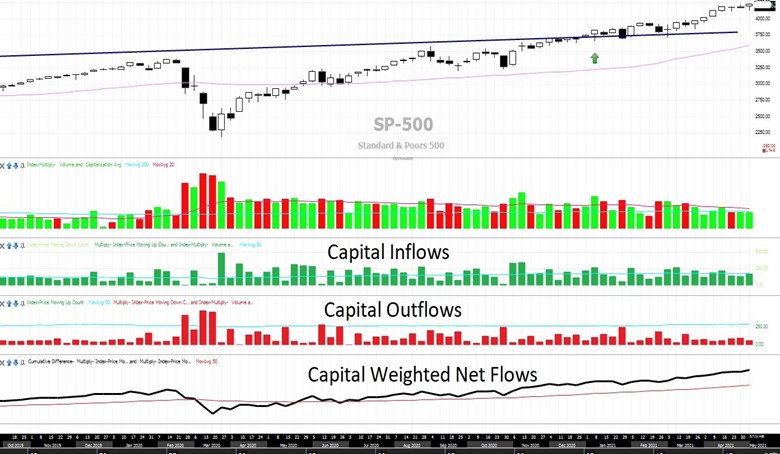
Chart #1 Source: Stockfinder: Worden Inc. Dates: (Oct 2019 – May 2021)
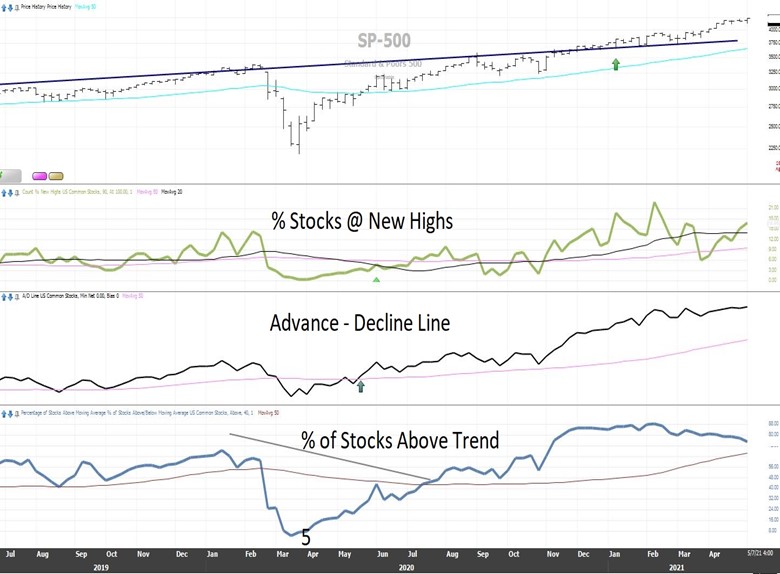
Chart #2 reflects three sets of market breadth indicators. Let’s begin with the “% of Stocks @ New Highs”. In the last edition of Volume Analysis, we pointed out this was the lone indicator flashing a warning signal. You can see the % of Stocks @ New Highs in the box directly underneath the S&P 500. Notice that the trend of % of Stocks at New Highs has since recovered from breaking beneath trend. Now that it has risen above trend, it once again confirms price. Next, observing the Advance-Decline line, this indicator continues to lead the market higher. However, on the very bottom panel of our chart deck, the % of Stocks Above Trend is actually losing ground. So although the market is trending ever higher, fewer stock components are trading above their own individual trends, suggesting caution. That stated, the number of stocks above trend still resides above its own trendline, thereby keeping it neutral…but worth closely watching.

Chart #2 Source: Stockfinder: Worden Inc. Dates: (July 2019 – May 2021)
Thus, all of our traditional leading indicators are either neutral, confirming or leading price movements.
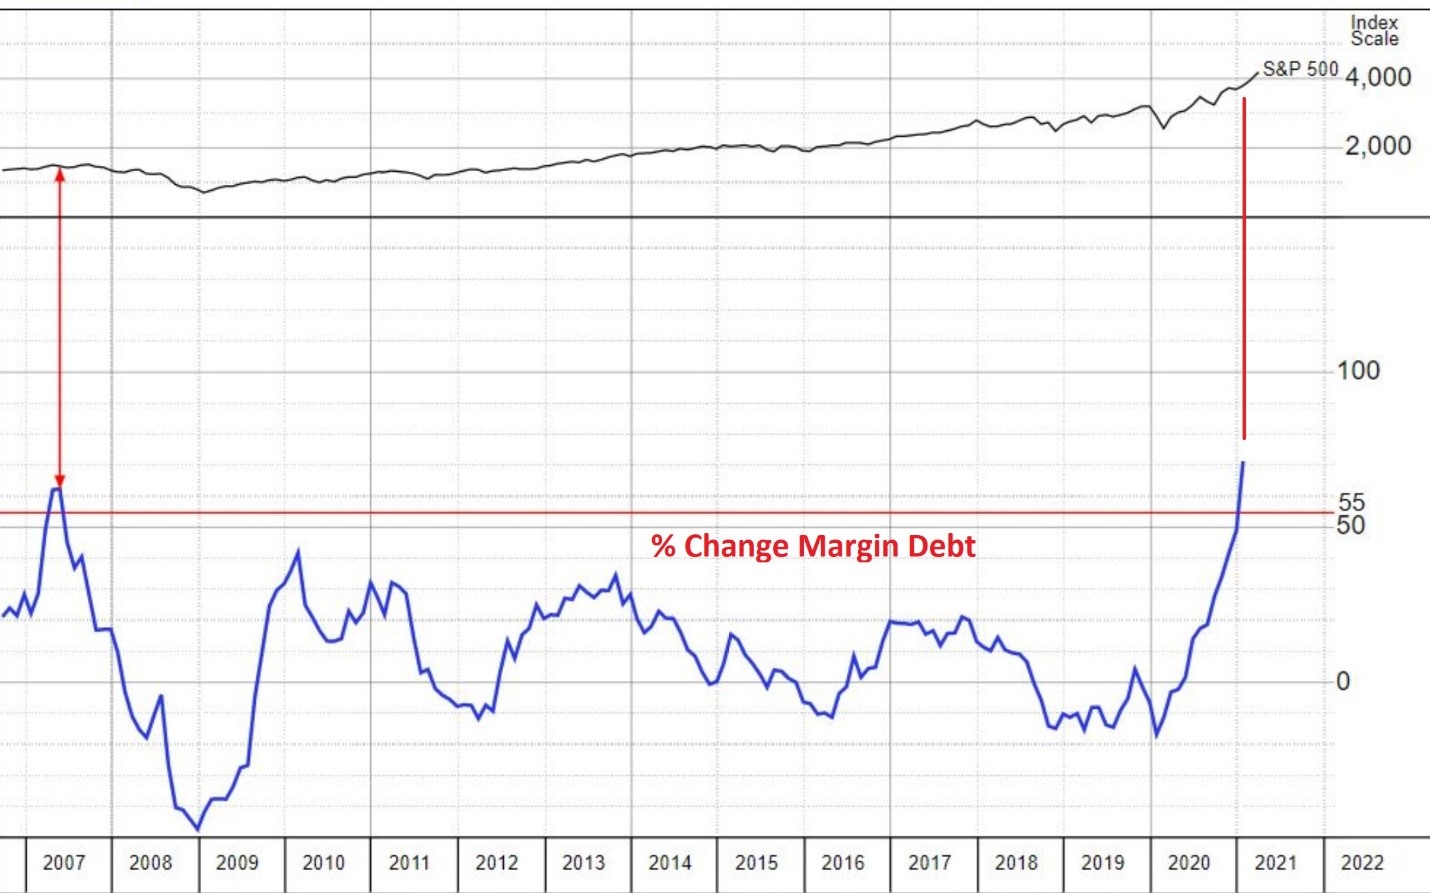
Next in Chart 3, a new indicator is introduced, the “Percent Change of Margin Debt”. The percentage change in margin debt is calculated by comparing today’s margin debt versus one year ago. Margin debt is a contrarian sentiment indicator warning of potential tops in the market, as evidenced by investors heavily borrowing against their investment portfolios. According to Investor Business Daily, a 55% year over year rise in margin debt is “a flag to a major top”. Presently, the positive year over year change in margin debt is 73%!!
This indicator has not flashed a warning signal since mid-2007, making it a new addition to our Volume Analysis indicator commentary.

Chart 3: % of Change in Margin Debt, Source: Investor Business Daily
Investor’s Business Daily states that Margin Debt Rate of Change has only triggered three times since the 1970s, making it a very rare signal. Typically, extremes in sentiment indicators may extend for some time before the market actually responds. So, this something to watch but not act upon until capital flow trends reverse.
Enjoy your week, my friends!! – Buff
DISCLOSURES
Kingsview Wealth Management (“KWM”) is an investment adviser registered with the Securities and Exchange Commission (“SEC”). Registration does not constitute an endorsement of the firm by the SEC nor does it indicate that KWM has attained a particular level of skill or ability. Kingsview Investment Management (“KIM”) is the internal portfolio management group of KWM. KIM asset management services are offered to KWM clients through KWM IARs. KIM asset management services are also offered to non KWM clients and unaffiliated advisors through model leases, solicitor agreements and model trading agreements. KWM clients utilizing asset management services provided by KIM will incur charges in addition to the KWM advisory fee.
Information presented is for informational purposes only and does not intend to make an offer or solicitation for the sale or purchase of any specific securities, investments, or investment strategies. It is not, and should not, be regarded as investment advice or as a recommendation regarding any particular security or course of action. Opinions expressed herein are current opinions as of the date appearing in this material only. This information does not address individual situations and should not be construed or viewed as any typed of individual or group recommendation. Be sure to first consult with a qualified financial adviser, tax professional, and/or legal counsel before implementing any securities, investments, or investment strategies discussed.
Past performance is no guarantee of future results. There are risks associated with any investment strategy, including the possible loss of principal. There is no guarantee that any investment strategy will achieve its objectives.
