Volume Analysis | 3.26.21
S&P 500
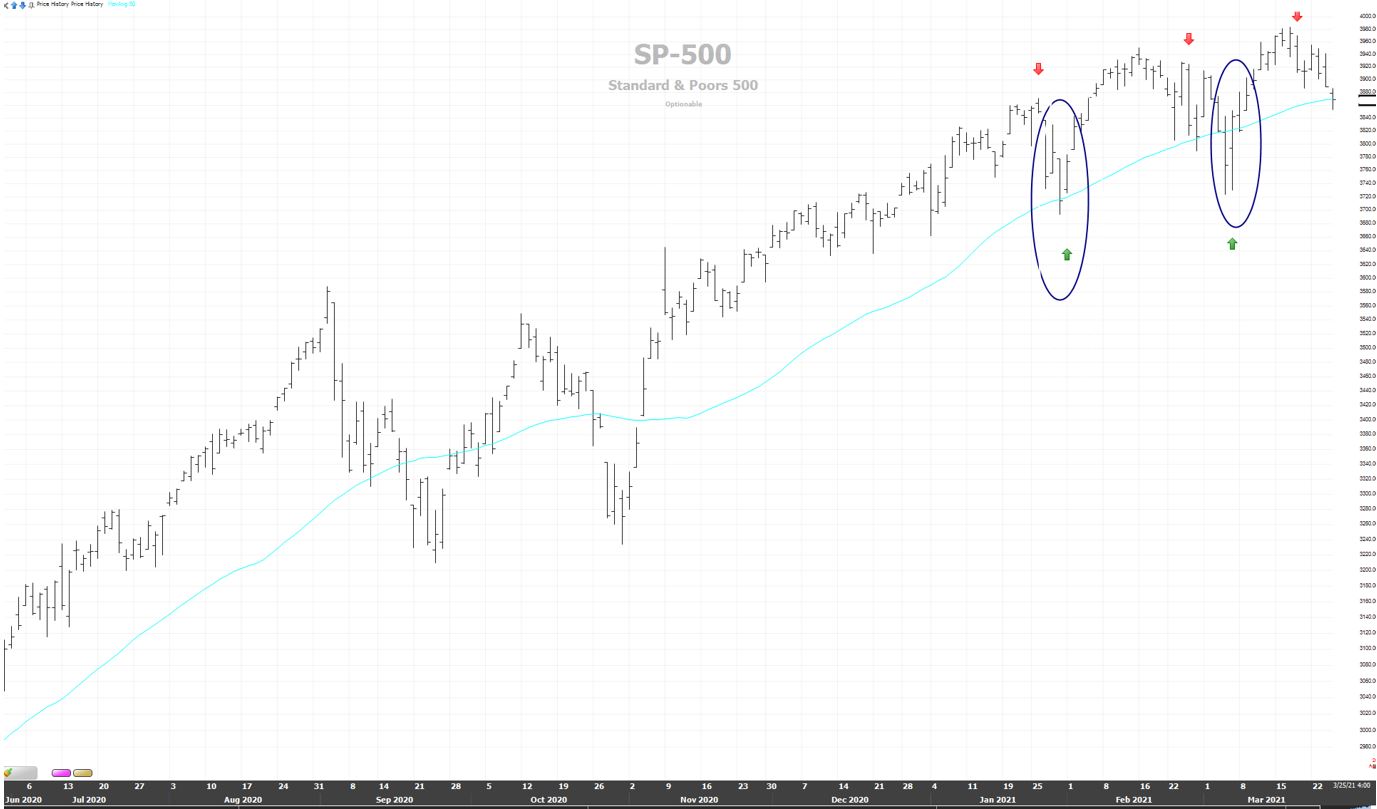
Source: Stockfinder: Worden Inc. Dates: (Jun. 2020 – Mar. 2021)
Like the movie Groundhog Day, although the price movements appear to be the same pattern repeating itself, market internals show a different picture. This is most apparent in the NASDAQ index depicted below.
NASDAQ INDEX
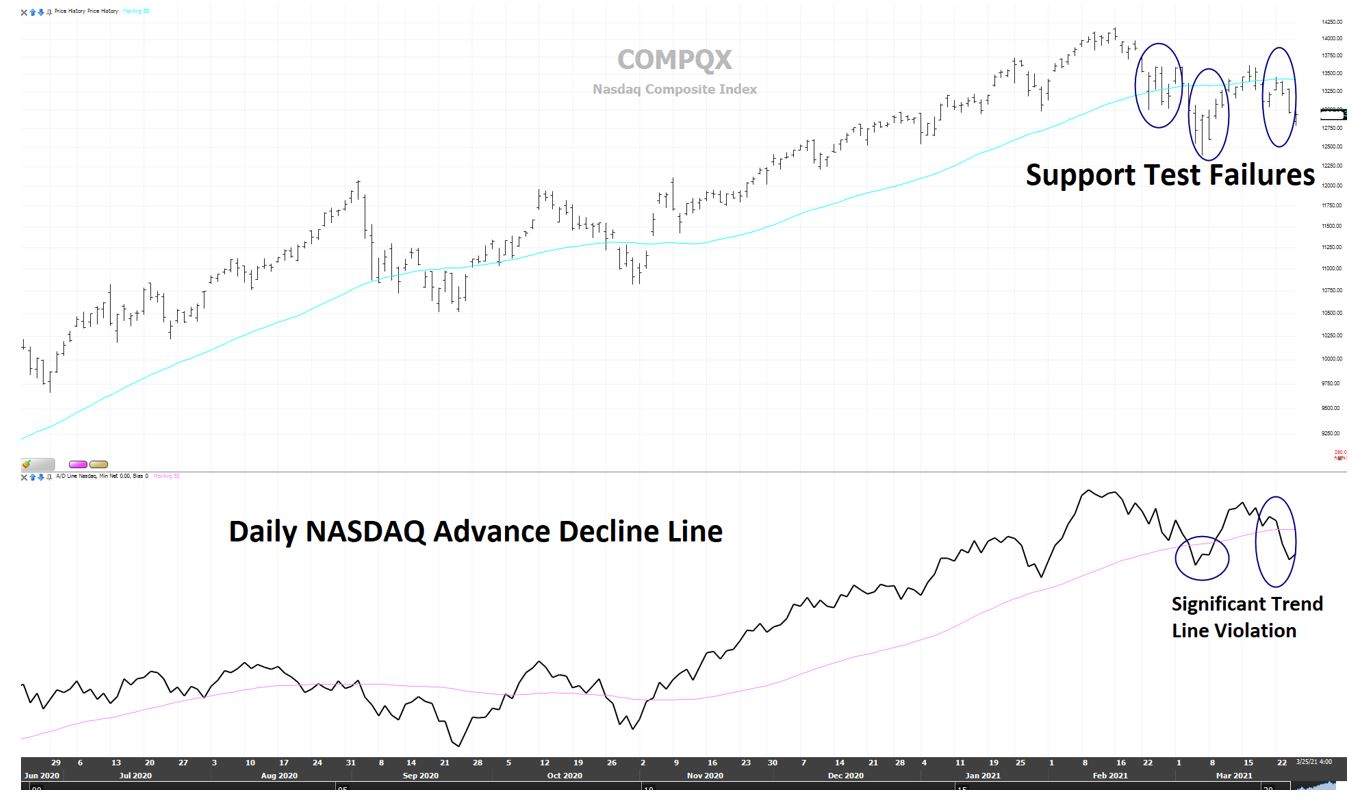
Source: Stockfinder: Worden Inc. Dates: (Jun. 2020 – Mar. 2021)
The NASDAQ was the leading index last year and has led the broad market indexes such as the S&P 500 higher for the last several years. But notice the three circles in the above chart. Once the NASDAQ broke its 50-day support line in late January, it has struggled to move above trend again, whereas the S&P 500 has regained its upward trend with each 50-day support line test (see Chart 1 S&P 500). Moreover, the daily NASDAQ Advance-Decline Line is well below its trend.
WEEKLY S&P 500
Source: Stockfinder: Worden Inc. Dates: (Apr. 2017 – Mar. 2021)
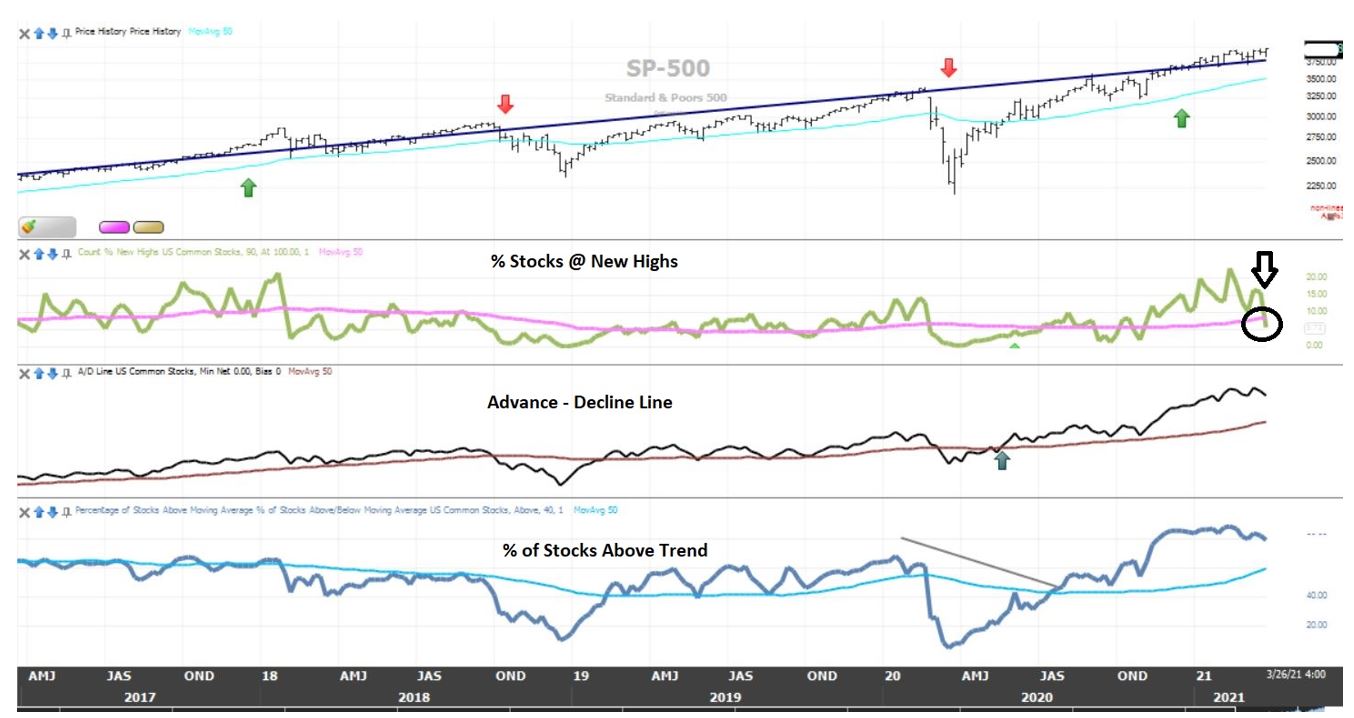
Next, let us review the weekly S&P 500 breadth data in the chart above. Unlike the NASDAQ, the weekly Advance-Decline Line is still trending higher, as is the % of Stocks Trading Above Trend. A positively trending Advance-Decline Line suggests plenty of liquidity is still fueling the markets. And the % of Stocks Trading Above Trend suggests that most stocks are holding support.
However, our fastest leading indicator, the % of Stocks Making New Highs, has now broken below its trend, represented by the pink line. The % of Stocks Making New Highs reveals how much overhead resistance lies in front of the market. Now that the % New Highs Line is below trend, the broad indexes may have a more difficult time moving higher through resistance.
CAPITAL WEIGHTED VOLUME
Source: Stockfinder: Worden Inc. Dates: (Dec. 2019 – Mar. 2021)
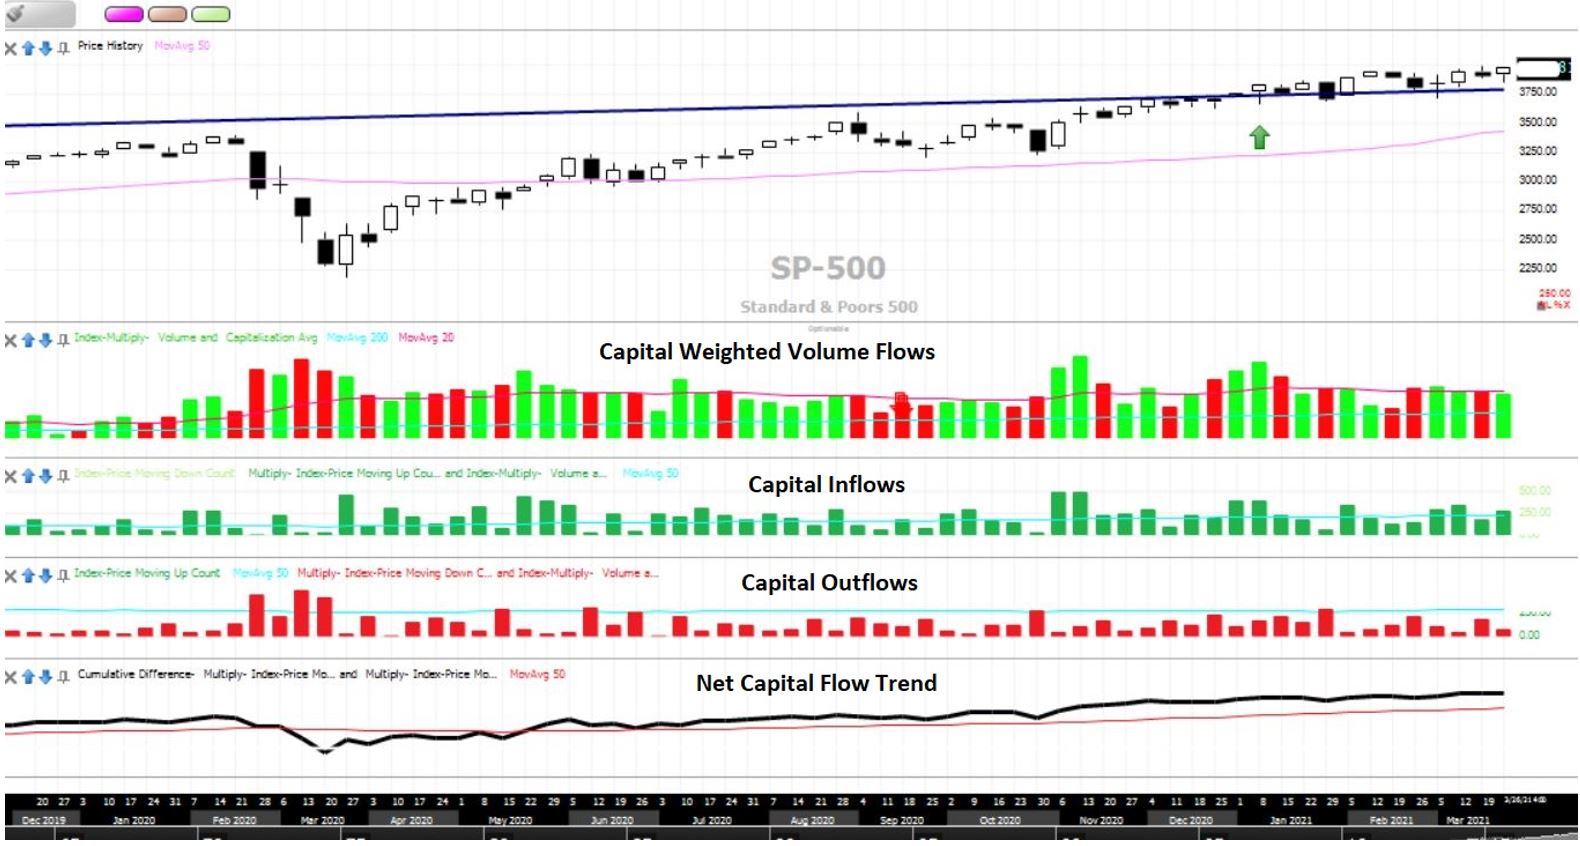
Now on to what we believe is our most important indicator, Capital Weighted Volume, depicted in the chart above. Notice that Net Capital Flow Trend continues to be inching higher and remains above trend. So long as these money flows continue higher, our risk mitigation system remains unemployed.
LONG-TERM TRENDLINE S&P 500
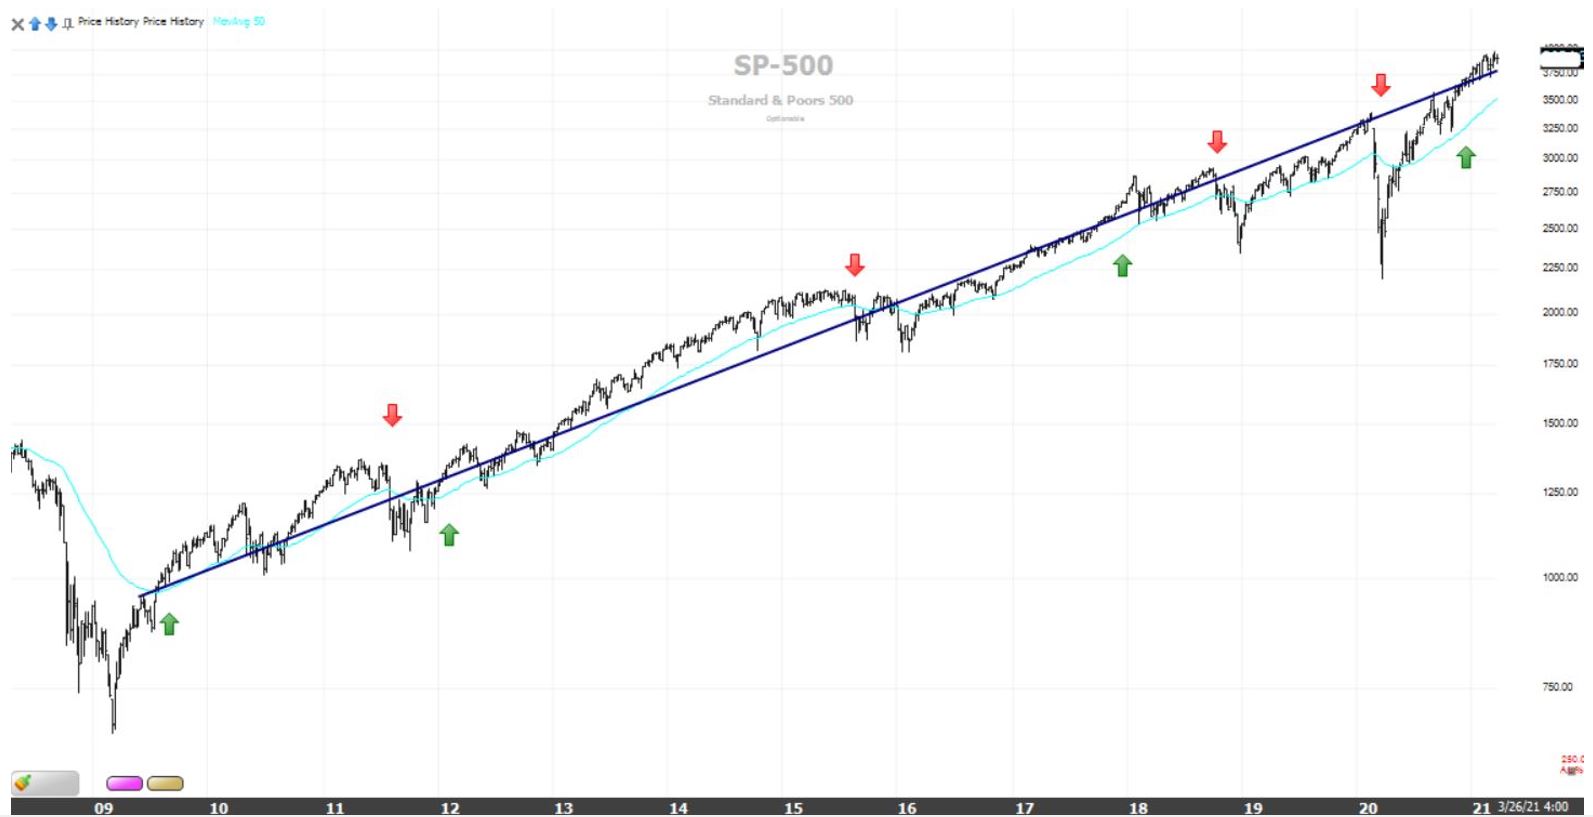
Source: Stockfinder: Worden Inc. Dates: (Oct. 2008 – Mar. 2021)
Finally, in our last edition of Volume Analysis, we highlighted the long-term trendline of the S&P 500. The critical support line was 3700. So far, trendline support has held. This support line has been moving up approximately 4.65 points per week and now rests at 3725.
Overall, although on the surface this market looks a lot like January and February, an inside look into March reveals some import variations which are not as bullish as previous months. So far, only one S&P 500 critical indicator is flashing a warning sign. The % of Stocks @ New Highs has broken below trend. This indicator is typically the first of our leading indicators to signal. Even so, sellers should beware, this indicator is not always followed by the others, and it could reverse higher again. The other significant bearish development has been the erosion of the NASDAQ and the NASDAQ Advance-Decline Line. We have been highlighting this shift in leadership since late last year, and were fortunate to invest in some NASDAQ positions this time last year. Going forward, we will be swapping out those positions into more traditional economy positions in our taxable accounts as the gains become long-term and at the end of the quarter in our qualified / non-taxable accounts.
Despite these chinks in the armor within the broad markets, most of our indicators remain either neutral or bullish. Given the mixed environment, we will be more cautious and selective going forward when buying dips. And as always, our risk management system is ever on duty within our active portfolios.
Stay safe and enjoy our gift of life, my friends!!
DISCLOSURES
Kingsview Wealth Management (“KWM”) is an investment adviser registered with the Securities and Exchange Commission (“SEC”). Registration does not constitute an endorsement of the firm by the SEC nor does it indicate that KWM has attained a particular level of skill or ability. Information presented is for educational purposes only and does not intend to make an offer or solicitation for the sale or purchase of any specific securities, investments, or investment strategies. Investments involve risk and unless otherwise stated, are not guaranteed.
Kingsview Investment Management (“KIM”) is the internal portfolio management group of KWM. KIM asset management services are offered to KWM clients through KWM IARs. KIM asset management services are also offered to non KWM clients and unaffiliated advisors through model leases, solicitor agreements and model trading agreements. KWM clients utilizing asset management services provided by KIM will incur charges in addition to the KWM advisory fee.
Information presented is for informational purposes only and does not intend to make an offer or solicitation for the sale or purchase of any specific securities, investments, or investment strategies. It is not, and should not, be regarded as investment advice or as a recommendation regarding any particular security or course of action. Opinions expressed herein are current opinions as of the date appearing in this material only. This information does not address individual situations and should not be construed or viewed as any typed of individual or group recommendation. Be sure to first consult with a qualified financial adviser, tax professional, and/or legal counsel before implementing any securities, investments, or investment strategies discussed.
Past performance is no guarantee of future results. There are risks associated with any investment strategy, including the possible loss of principal. There is no guarantee that any investment strategy will achieve its objectives.
