Volume Analysis | 3.1.21
“Often overly optimistic sentiment readings lead to a pause in the trend. Should the market pullback near term,sentiment-driven dips in this type of environment typically represent good entry points.”
Following this January 25th publication, we immediately witnessed a strong selloff, taking the S&P 500 down to its 50-day trend at 3725 . Upon testing this support line, the market then rallied strongly back to new all-time highs, peaking out at 3950. Yet this past week, the market once again pulled back to its 50-day trendline, presently at 3800.
The 50-day trendline represents the average price an S&P 500 investor experienced over the last 50 days. Historically,when the price falls back to this level within an uptrend, often the market finds support. Support comes from buyers, who are not intentionally trying to keep the market trending up. Rather, these investors are looking for good entry points. Their purchases unwittingly push the S&P 500 back above trend. Similar to the last week in January, this same dance appeared to occur during the final week of February.
DAILY CAPITAL S&P 500 FLOWS

Source: Stockfinder: Worden Inc. Dates: (Nov. 2020 – Feb. 2021)
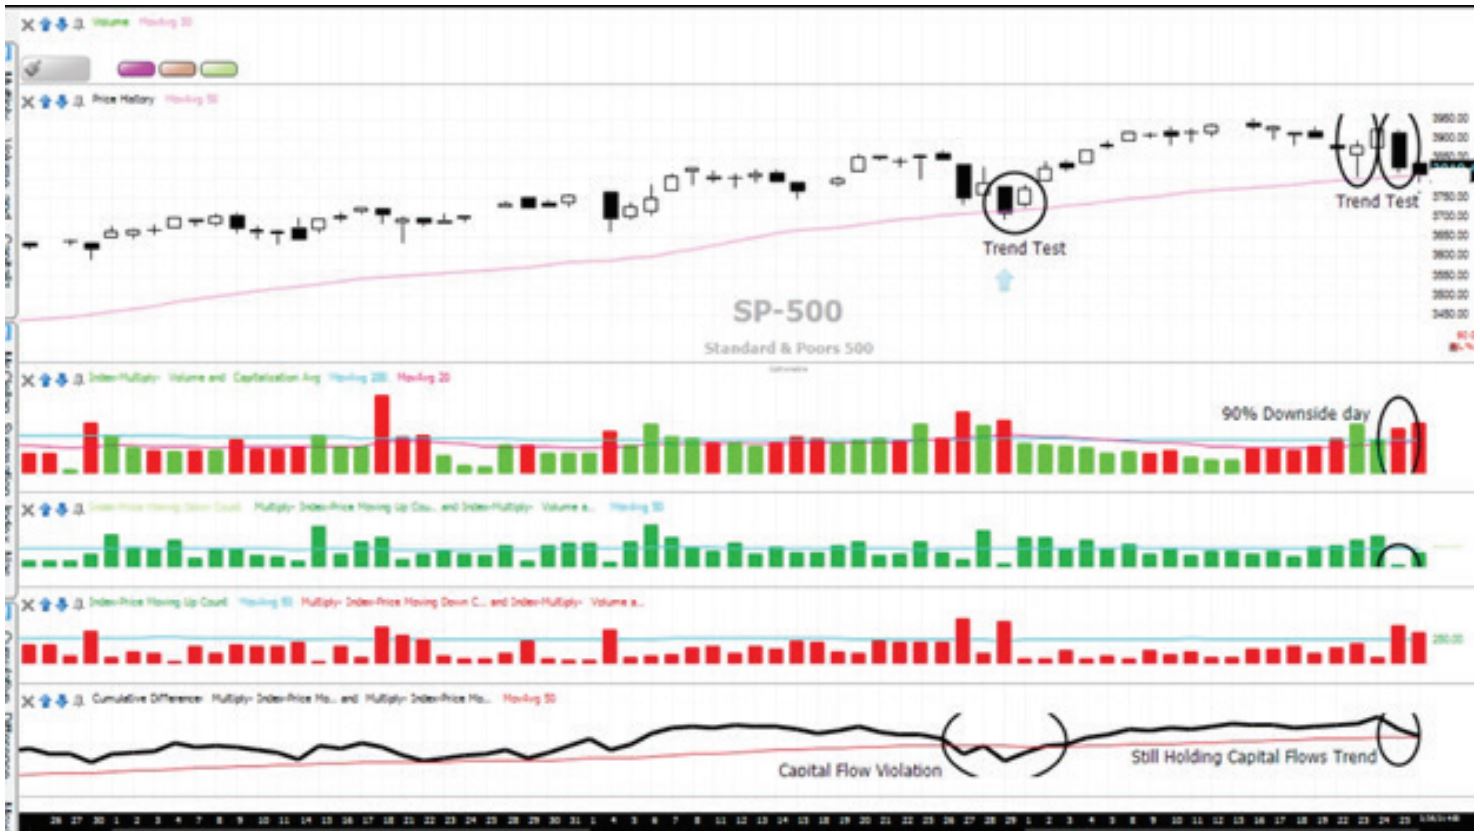
Referencing the chart above, on Tuesday, February 23rd, the market tested the pink line, the aforementioned S&P 500’s 50-day moving average. Upon hitting the 50-day average, the market rallied back to close higher on Wednesday. Then Thursday, the 25th, the market’s low point once again tested the 50-day moving average. Finally, Friday the 26th, the market violated its 50-day moving average intraday but closed slightly above it.
This places the market at an inflection point. The 50-day support of the S&P 500 is 3800. If the market were to break and close below this 3800 level, that action could send us to the next level of 3700, which we will discuss later. But for now, let’s examine the evidence for and against a bounce.
Beginning with the evidence against a bounce-back rally, note the previous chart labeled Daily Capital Flows. Thursday,the market experienced a 90% downside Capital Weighted Volume day as indicated on the capital weighted volume bars below the price chart. Remember when the market bottomed in March last year? Clusters of 90% Upside Capital Weighted days were one of the signs we pointed out as entry signals. We do not have clusters presently; nonetheless, we believe this an important item of note.
The other piece of evidence we believe favors the bears is that the number of stocks making new weekly highs has been dropping precipitously and is now nearing trendline support of its own. See the chart below labeled “Weekly Breadth Indicators.” The percentage of stocks making new highs is frequently our fastest leading indicator, meaning it often signals first. Notice in the chart below labeled “% of Stocks @ New Highs” how the prior 50-day test (first arrow) did not test its trendline. However, during this pullback, we are currently nearing support, albeit holding for now.
DAILY BREADTH INDICATORS

Source: Stockfinder: Worden Inc. Dates: (May 2019 – Feb. 2021)
Now the bullish case. Notice in the same chart above, the balance of our breadth indicators, the advance-decline line and the % of stocks above trend are both well above their respected trendlines. Now let’s go back to our first chart,
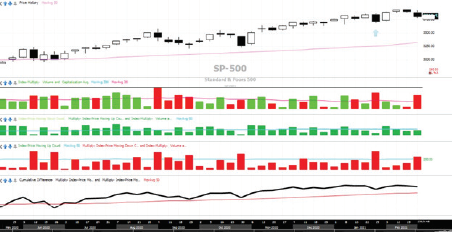
Daily Capital S&P 500 Flows. Notice the January trend test of the S&P 500. During this first pullback, capital market flows broke trend. However, in this most recent test, capital flows are still holding above trend. That means that overall, less capital is flowing out of the market despite our 90% downside day. And moving to the chart below, weekly capital flows are still healthily above trend.
WEEKLY CAPITAL FLOWS

Source: Stockfinder: Worden Inc. Dates: (May 2020 – Feb. 2021)
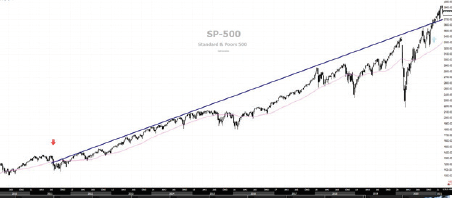
If the market were to break 3800, the next support is 3700. 3700 is a very important trendline dating all the way back to July of 2011 (see chart below labeled S&P 500 Trendline)! Since this trend began, the S&P has moved up 4.65 points per week. Notice in November, we broke above trend. Maintaining above this trendline is vital for the Bulls. We believe a violation of this well-established uptrend line would represent a pause in the markets’ pace of accent.
In summary, next support is 3800, the S&P 500’s 50-day average. Major trendline support resides at 3700, the S&P 500’s up-trendline. Overall, it is our belief that the weight of the evidence remains in favor of the bulls. Like the pullback in late January, we are using this pullback to work in new cash. However, risk management is critical in portfolio management. We will continue to watch our leading indicators for potential shifts while monitoring market trends. Here’s to enjoying the voyage, my friends!
S&P 500 TRENDLINE

Source: Stockfinder: Worden Inc. Dates: (Jan. 2010 – Feb. 2021)
DISCLOSURES
Kingsview Wealth Management (“KWM”) is an investment adviser registered with the Securities and Exchange Commission (“SEC”). Registration does not constitute an endorsement of the firm by the SEC nor does it indicate that KWM has attained a particular level of skill or ability. Information presented is for educational purposes only and does not intend to make an offer or solicitation for the sale or purchase of any specific securities, investments, or investment strategies. Investments involve risk and unless otherwise stated, are not guaranteed.
Kingsview Investment Management (“KIM”) is the internal portfolio management group of KWM. KIM asset management services are offered to KWM clients through KWM IARs. KIM asset management services are also offered to non KWM clients and unaffiliated advisors through model leases, solicitor agreements and model trading agreements. KWM clients utilizing asset management services provided by KIM will incur charges in addition to the KWM advisory fee.
Information presented is for informational purposes only and does not intend to make an offer or solicitation for the sale or purchase of any specific securities, investments, or investment strategies. It is not, and should not, be regarded as investment advice or as a recommendation regarding any particular security or course of action. Opinions expressed herein are current opinions as of the date appearing in this material only. This information does not address individual situations and should not be construed or viewed as any typed of individual or group recommendation. Be sure to first consult with a qualified financial adviser, tax professional, and/or legal counsel before implementing any securities, investments, or investment strategies discussed.
Past performance is no guarantee of future results. There are risks associated with any investment strategy, including the possible loss of principal. There is no guarantee that any investment strategy will achieve its objectives.
