Volume Analysis | 1.25.21
The beginning of a New Year is akin to an ocean adventure. We will likely experience untested winds and unanticipated waves. We will pass ships we’ve never known and find new opportunities as we sail an uncharted sea.
In our quests for profit, we must be careful to chart our own course and not drift aimlessly. The worst possible scenario, perhaps, would be to allow news and events to dictate our direction.
A financial plan should serve as the anchor for your investing and spending decisions, preventing you from wandering off course in busyness or distraction. Most importantly, it should be steadfast and strong, securing you in the midst of any potential storms and allowing you to stay true to your core beliefs.
My life anchor is the holy scriptures. The Word keeps me grounded in truth, forms my values, leads me to a call of service, offers ambitions of purity and provides the perspective of vision.
As a technical analyst, my professional anchor is capital flows. Investing in the capital markets is the toughest competition in the world. It is where the wealthiest institutions, employing the wisest minds and implementing the most advanced resources roam. Collectively, these people are investing billions of dollars.
By billions invested, I am not referring to their capital. That would be trillions of dollars. Rather, these billions are the cumulative research budgets used to “beat” the market. Occasionally, one might get lucky and outwit them, but over time, trying to outmaneuver the strong-handed, smart money will likely lead to poor results…pardon the pun.
By tracking their capital flows, our goal is not to beat them but instead to closely trace their course, potentially sharing in their success.
Many of you have asked me for my outlook for 2021. Due to the nature of capital flows, it can be challenging to provide that perspective. I am following the path another is blazing. However, I will go out on a bit of a limb and share my thoughts away from my primary perspective.
Envisioning 2021’s outlook calls to mind a market one decade ago, in 2011. In 2009, the Federal Reserve began quantitative easing. By 2011, we began a mild recovery in our economy. As the economy improved in 2011, the Fed began to question how much more stimulus was necessary and their resulting policy was known as “Operation Twist”. What a perfectly appropriate name, because “Operation Twist” turned the market into a pretzel!
In 2021, it now appears that the pandemic may weaken faster than previous expectations. Like in 2011, as the economy reopens, the Federal Reserve may again question the necessity for the current amount of stimulus. Also similar to 2011, the good news of economic recovery may lead to disappointment should the market lose the tailwind presently generated by the Federal Reserve. 2011 was neither a bad market nor a good market…but it was sure was wild, fluctuating up and down like a yo-yo. I am not implementing market action on this 2011 analogy, only mentally preparing myself for the possibility.
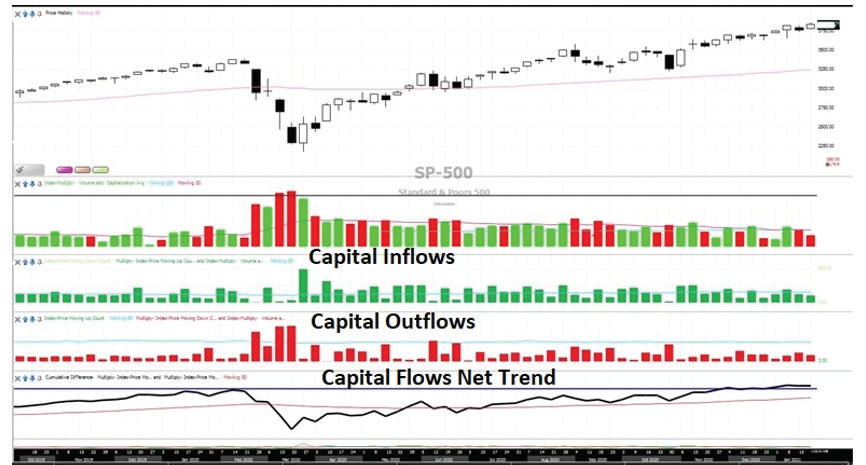
Returning to our core anchor of capital flows in the chart below, notice the trend of capital continues to move steadily up. This is the most important data set in my work. With capital trending up, we remain in a bull market. However, the capital flows are trailing the market’s price appreciation, which gives us pause when considering the rapid deployment of new capital.
Source: Stockfinder: Worden Inc
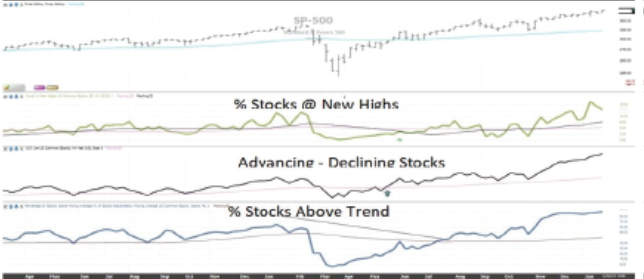
Referencing the chart below, more stocks are appreciating than declining as the advance-decline line is at all-time highs. This tells us that there is plenty of liquidity within the market. Next, a high percentage of stocks are in uptrends, and that percentage has been steadily growing. Finally, looking at the top panel on the chart below, you can see a large percentage of stocks are making new highs. However, please also note that this number has dropped over the past few weeks despite the market moving higher. This % Stocks @ New Highs indicator is often the fastest of our leading indicators.
Source: Stockfinder: Worden Inc. Dates
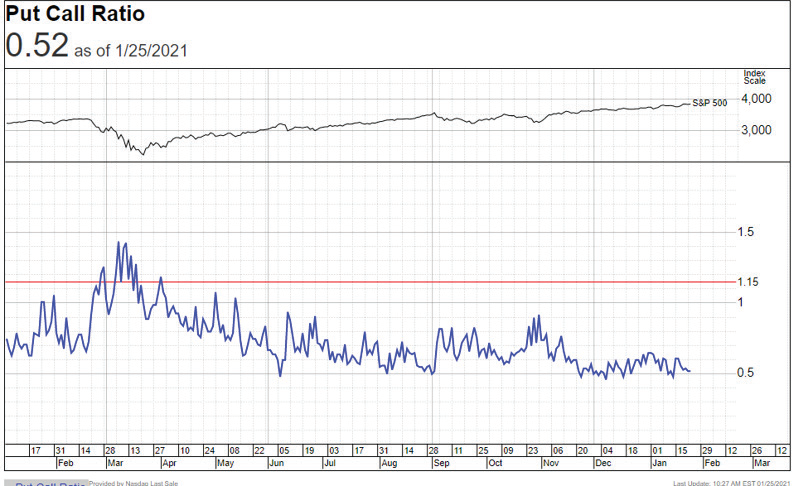
We do not often point out sentiment indicators because they tend to be valuable only at extremes. Yet, we are beginning to see extreme exuberance in some sentiment readings. Our first example is the Put / Call Ratio. When the number of Puts is half the number of Calls or less, it is often a short term sign of over optimism. Presently we are at 52% puts to calls.
Source: Investor’s Business Daily
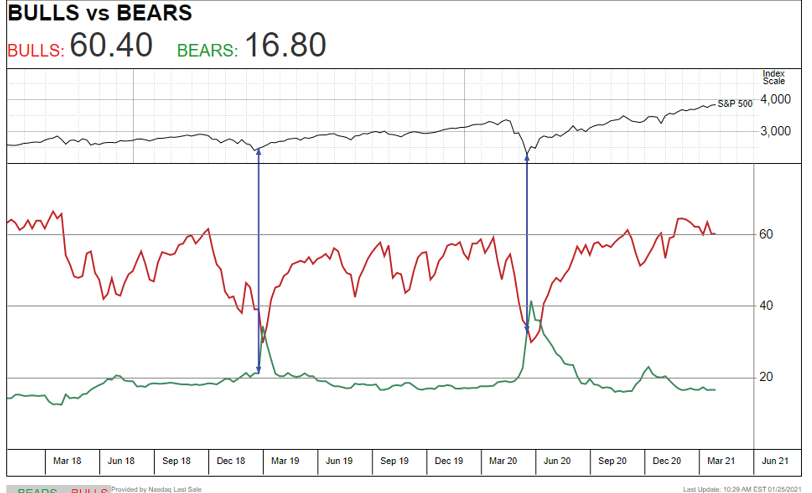
Next, Investors Intelligence publishes the percentage of market letters writers who are bullish versus bearish. Like most sentiment indicators, this is also a contrarian indicator meaning the more bullish the writers, typically the less favorable it is for the market going forward. Presently, over 60% of market writers are positive, but only 16% are bearish. This is an extremely low reading of bears.
Source: Investor’s business Daily
Finally, the National Association of Active Investment Managers publishes their members’ net exposure to the market. The latest reading was 113%, meaning the average NAAIM member is leveraged up 13%, which is also extremely optimistic.
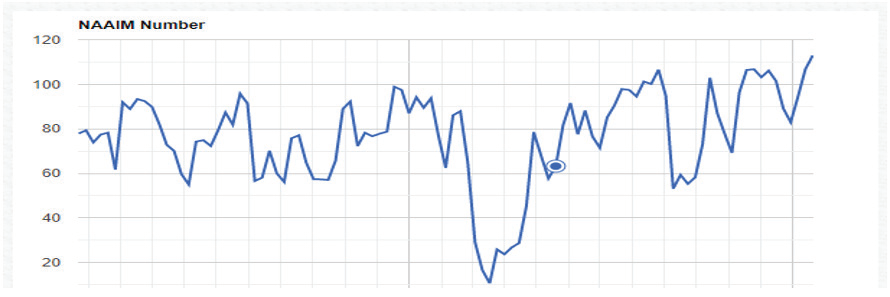
Source: NAIM
DISCLOSURES
Kingsview Wealth Management (“KWM”) is an investment adviser registered with the Securities and Exchange Commission (“SEC”). Registration does not constitute an endorsement of the firm by the SEC nor does it indicate that KWM has attained a particular level of skill or ability. Information presented is for educational purposes only and does not intend to make an offer or solicitation for the sale or purchase of any specific securities, investments, or investment strategies. Investments involve risk and unless
otherwise stated, are not guaranteed.
Kingsview Investment Management (“KIM”) is the internal portfolio management group of KWM. KIM asset management services are offered to KWM clients through KWM IARs. KIM asset management services are also offered to non KWM clients and unaffiliated advisors through model leases, solicitor agreements and model trading agreements. KWM clients utilizing asset management services provided by KIM will incur charges in addition to the KWM advisory fee.
Historical references do not assume that any prior market behavior will be duplicated. Past performance does not indicate future results. This material has been prepared by Kingsview Wealth Management, LLC. It is not, and should not, be regarded as investment advice or as a recommendation regarding any particular security or course of action. Opinions expressed herein are current opinions as of the date appearing in this material only. All investments entail risks. There is no guarantee that investment strategies will achieve the desired results under all market conditions and each investor should evaluate their ability to invest for the long term. This information does not address individual situations and should not be construed or viewed as any typed of individual or group recommendation. Be sure to first consult with a qualified financial adviser, tax professional, and/or legal counsel before implementing any securities, investments, or investment strategies discussed.
