
Portfolio Manager Insights | What Rising Real Yields Mean for Investors - 7.29.26
Click here to download this commentary in PDF format.
Treasury rates have surged to their highest levels in recent years due to a combination of concerns around inflation, oil prices, the national debt, and the Fed. The 10-year Treasury yield is once again above 4.6% and the 30-year has been above 5% for the longest streak since 2007.1 In general, this is positive for long-term investors since higher yields support portfolio goals such as income and stability.
Perhaps more importantly, real yields have risen even further. For investors, these moves are helpful to understand because they influence many aspects of investing and planning. Portfolios and financial plans should take these evolving interest rates and economic circumstances into careful consideration, especially because they have changed significantly over the past decade.
The difference between nominal and real interest rates is quite simple, even if it sounds technical. A nominal yield is simply the stated interest rate on a bond, whether it’s a corporate investment grade bond or a U.S. Treasury note. The real yield goes one step further by showing what an investor earns after adjusting for inflation. Real yields represent the true return for savers, and therefore serve as a key benchmark against which all other asset classes are measured. Given the importance of rising real yields, what do investors need to consider?
Long-term real yields are near multi-year highs
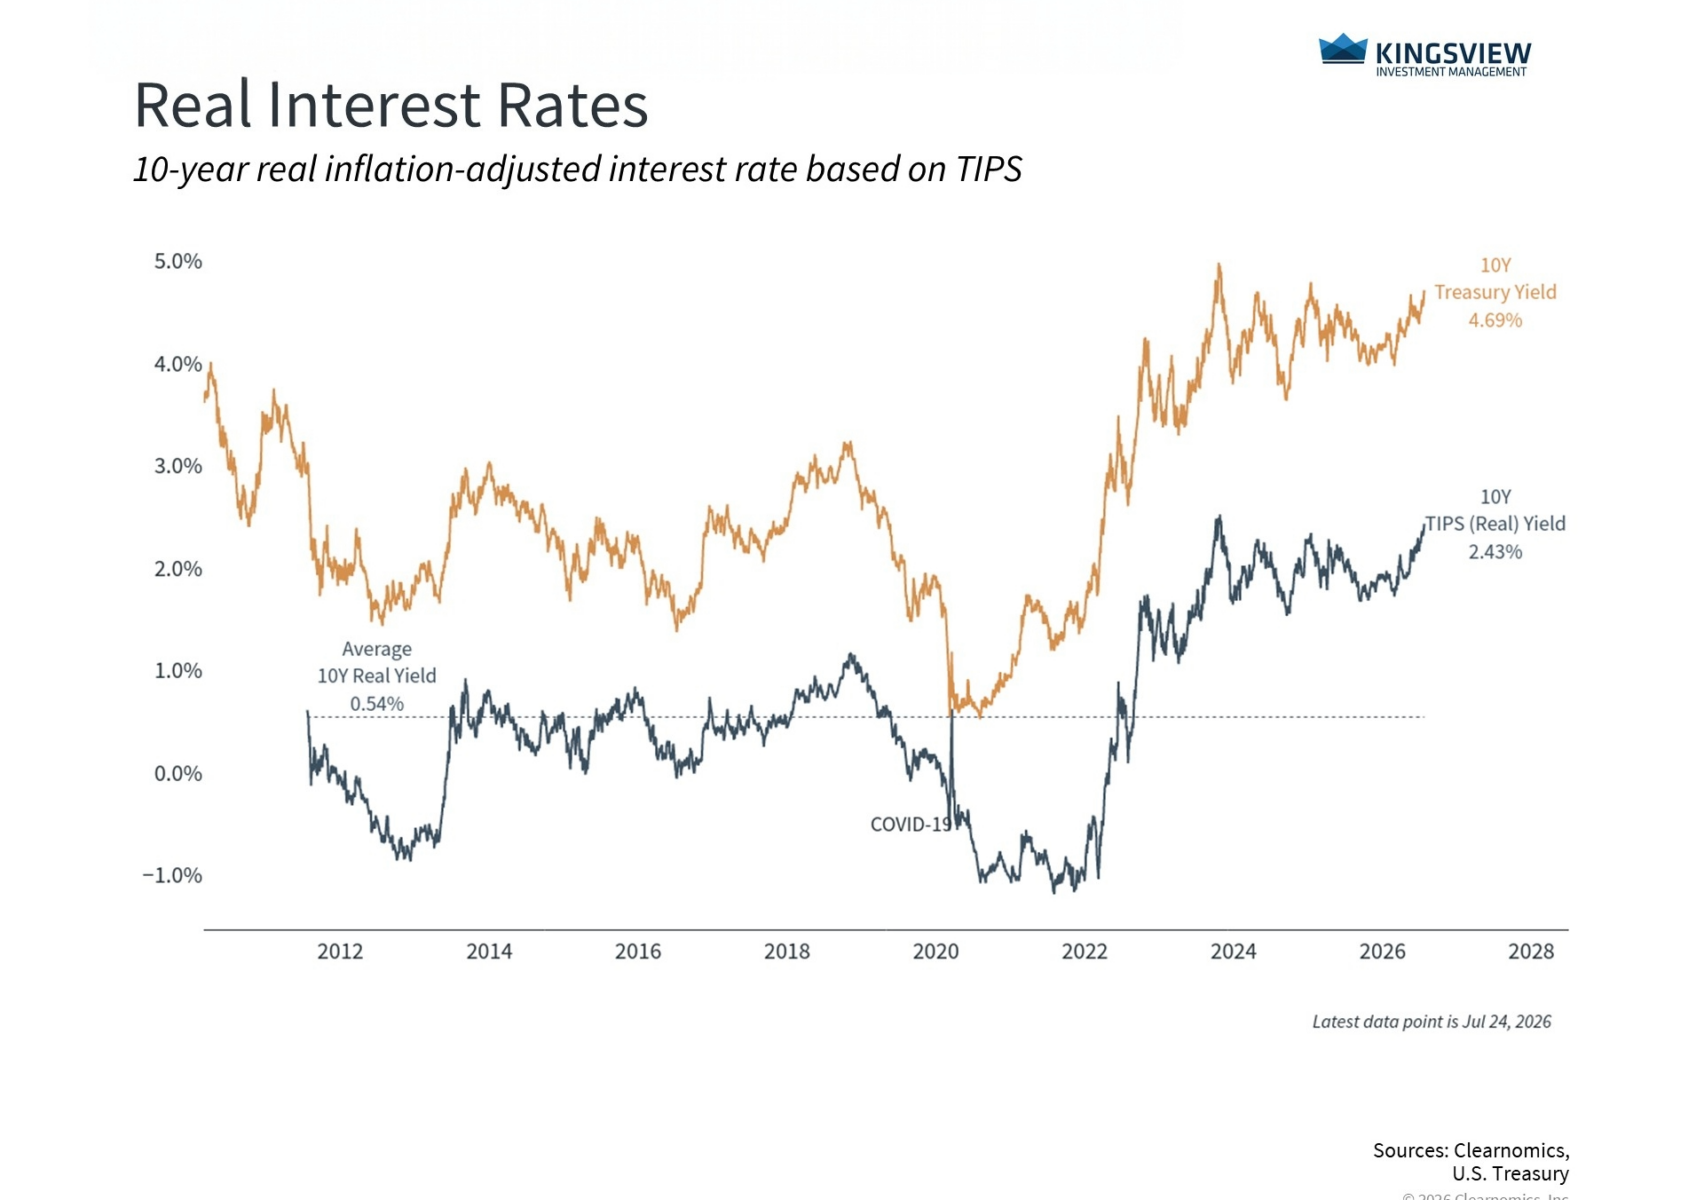
The chart above shows how real yields have evolved over the past decade and a half. In 2020, for instance, real yields on government bonds actually turned negative, meaning investors were either expecting little to no inflation in the coming years, or accepting a guaranteed loss of purchasing power for the safety of U.S. Treasury securities. This was in large part by design as the Fed cut rates to support the economy and push investors toward stocks, real estate, and other higher-yielding assets.
Yields then shifted in 2022 when inflation spiked, prompting the Fed to reverse course by raising the federal funds rate at the fastest pace in decades. Both nominal and real yields surged as a result. Today, the 10-year nominal Treasury yield stands at roughly 4.7% while the corresponding real yield is 2.4%, well above levels since the global financial crisis. This is based on expectations of inflation over the next ten years, and not just the latest figures.
Several factors are keeping long-term yields elevated today. Oil prices have risen back above $90 per barrel for Brent crude amid the ongoing war in Iran, and gasoline prices have climbed back above $4 per gallon nationally.2 Higher energy costs can feed directly into broader inflation, which in turn pushes nominal yields higher. What’s interesting is that inflation expectations haven’t risen much based on market measures and surveys, but this is largely because many anticipate the Fed may raise rates over the next several months to fight rising prices.
Separately, the rising national debt and federal budget deficit continue to create uncertainty for government bond yields. This affects what economists call the “term premium,” or the extra yield investors require to hold longer-term bonds. With the total national debt now above $39 trillion, greater interest payments naturally raise the borrowing cost for the government, pushing U.S. Treasury yields higher.3
Higher yields affect all parts of the market
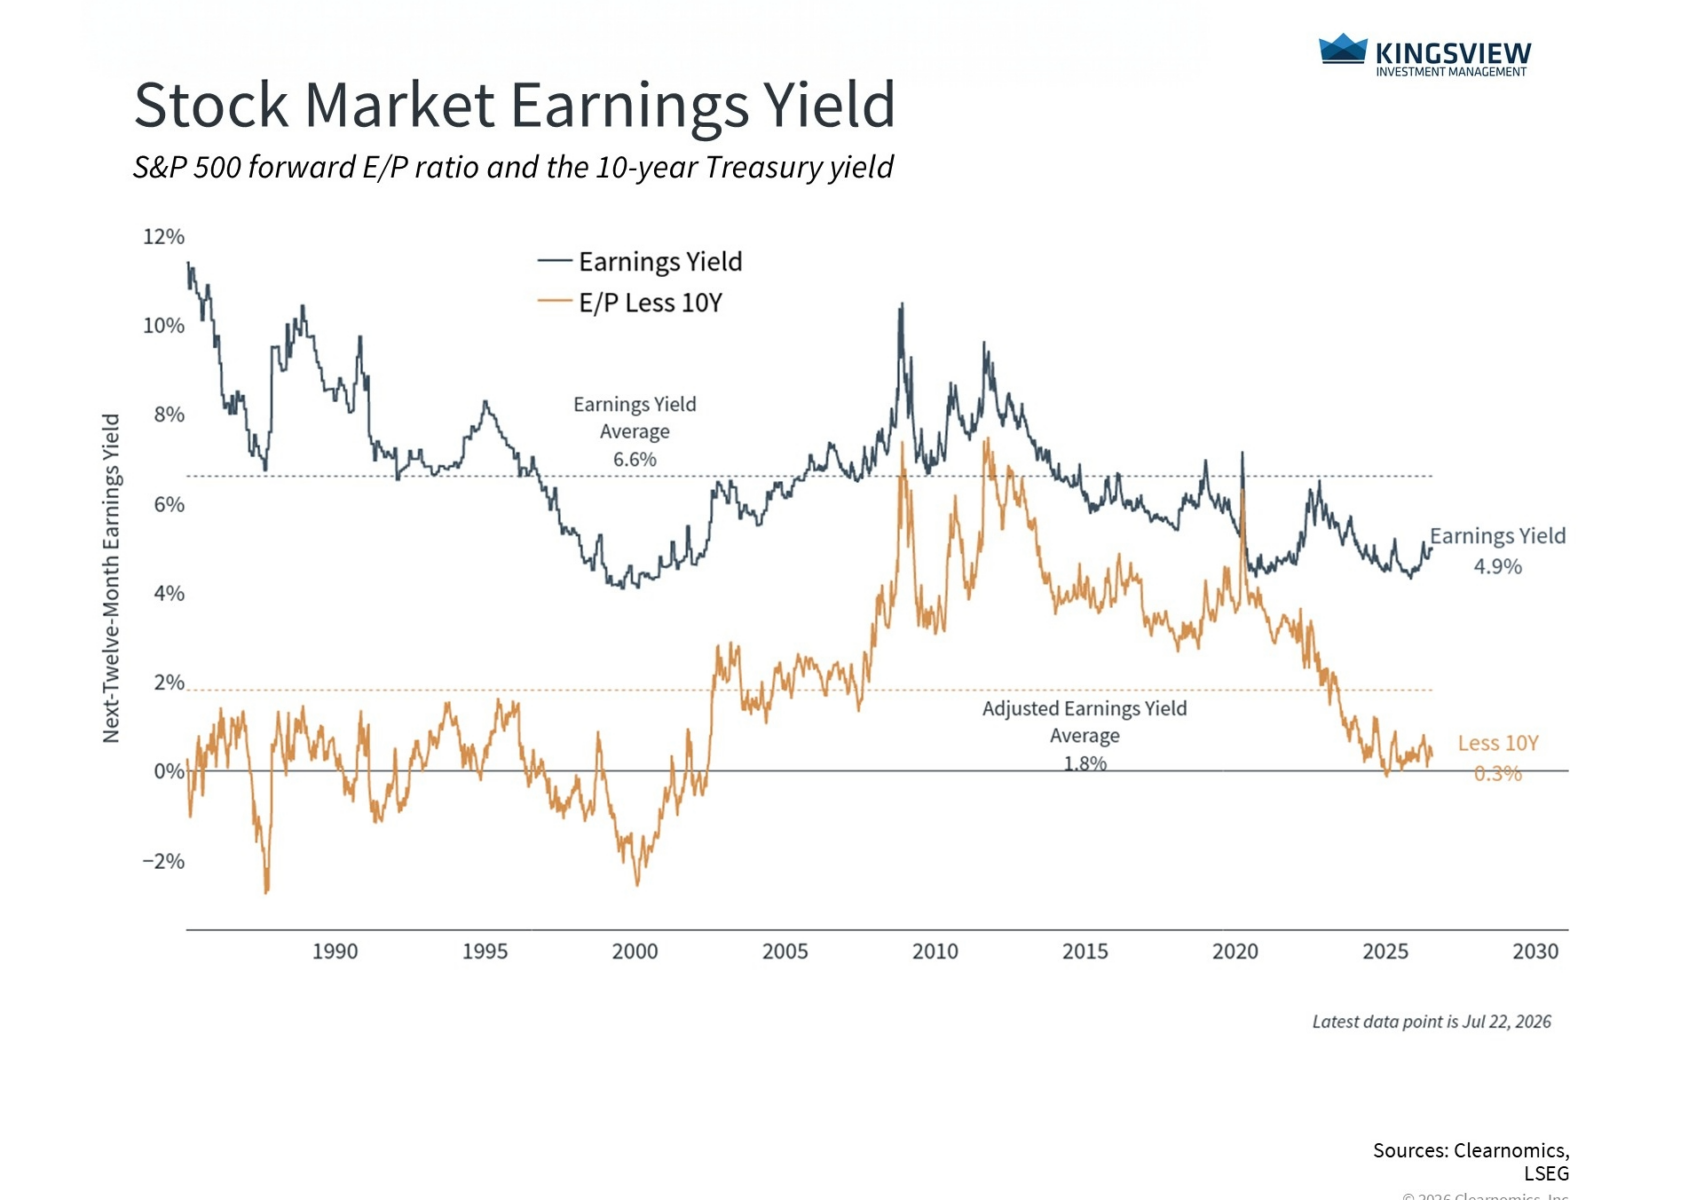
Interest rates are not just about bonds, but affect how attractive different asset classes are compared to one another. This is especially important for long-term investors since it influences the relative attractiveness of different asset classes in a balanced portfolio. For example, the chart above shows the S&P 500 earnings yield, which is the level of earnings-per-share divided by the price of the S&P 500. This is an important valuation measure that helps us compare the stock market against bond yields.
This comparison is often referred to as the “equity risk premium” since it measures how much additional benefit is available for taking on greater risk in the stock market. When real bond yields were near zero or negative, as they were for much of the post-2008 era, stocks had little competition. Investors accepted lower earnings yields from equities because there were few alternatives for yield and growth. This was commonly referred to as TINA, or “there is no alternative.”
At current levels, the 10-year real yield of 2.4% means that investors can earn an attractive, inflation-adjusted return from government bonds. The S&P 500 earnings yield sits at roughly 4.9%, corresponding to a forward price-to-earnings ratio of around 20x. This means that understanding and evaluating the balance of stocks and bonds in a portfolio is potentially more important than before.4
The Fed balance sheet and what it means for yields
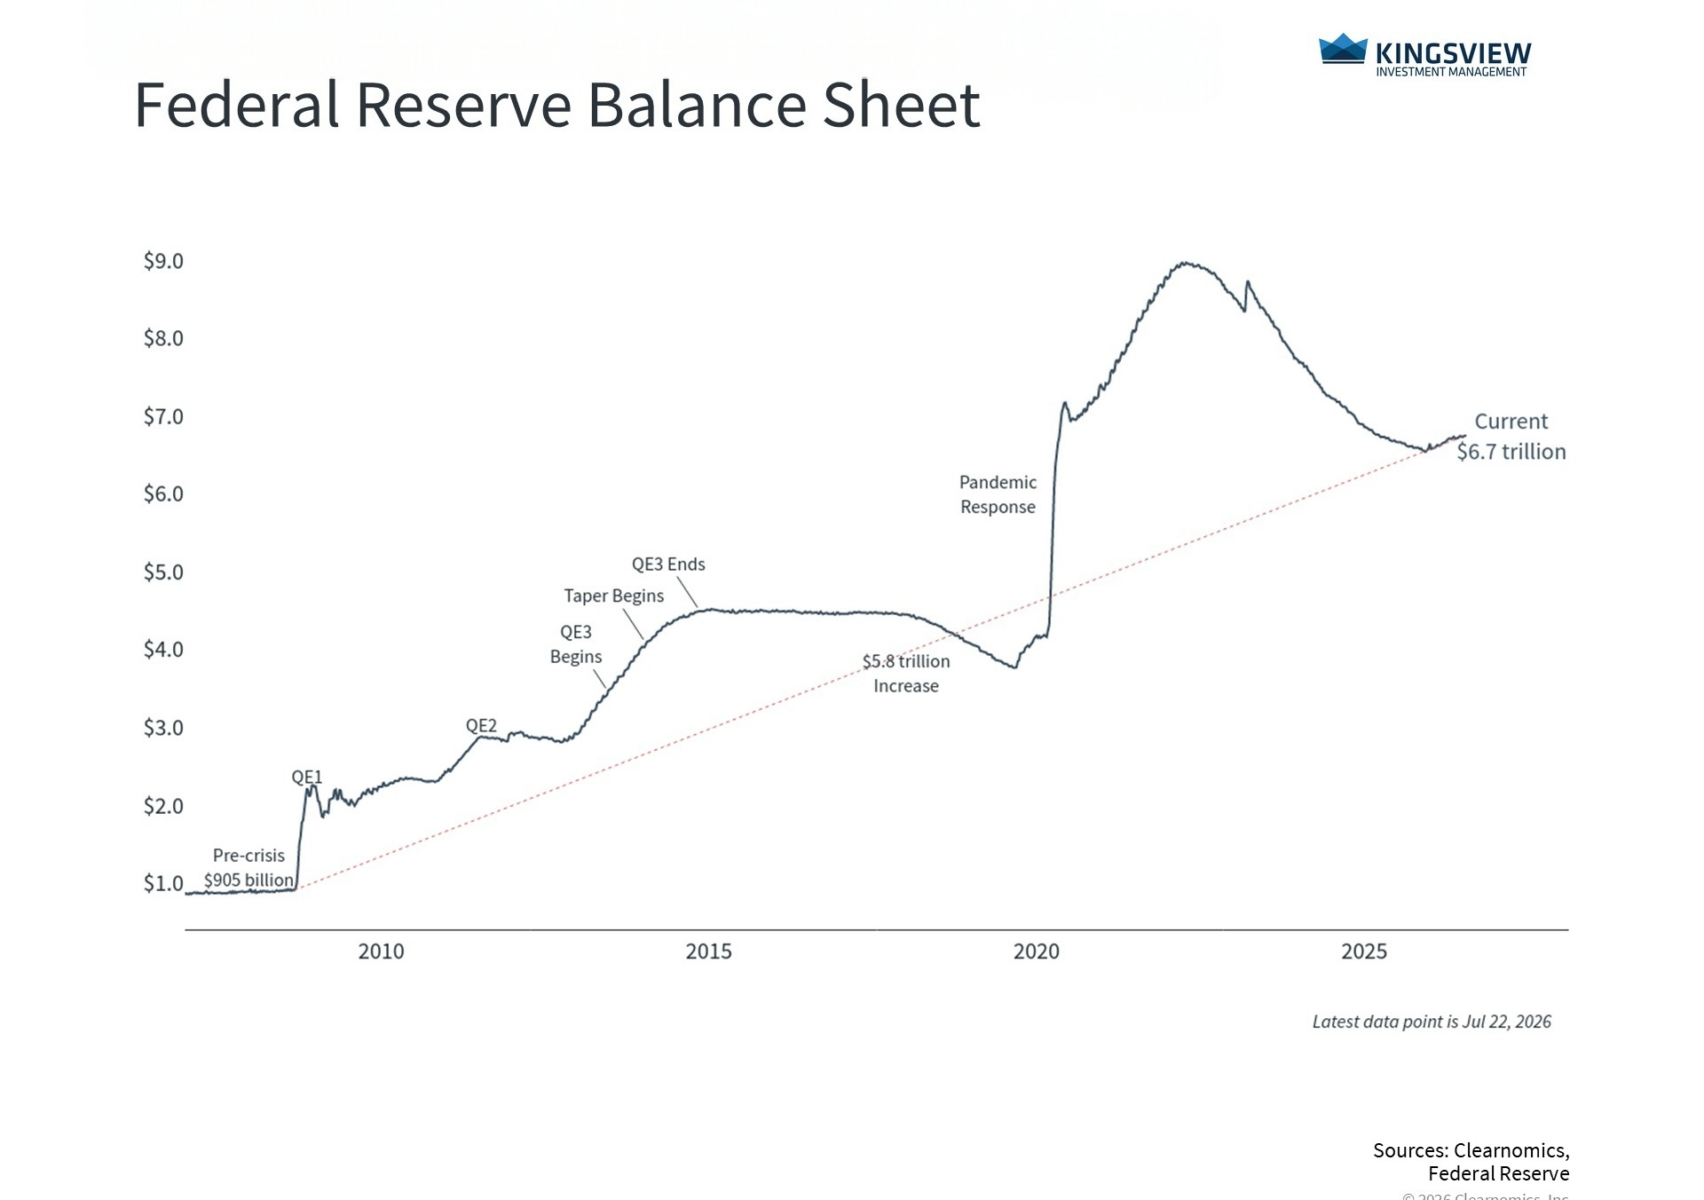
Another factor affecting bond yields is uncertainty around Fed policy under the new leadership of Kevin Warsh. One task force he has launched, for instance, seeks to address the central bank’s $6.7 trillion balance sheet.5 As shown in the chart above, the level of assets held by the Fed has increased with each economic crisis. While it has shrunk in recent years as assets have matured, it is still far larger than it was prior to 2008.
Warsh has long held the view that the Fed ought to shrink its balance sheet when the economy is healthy. This would involve selling Treasury securities and mortgage-backed securities, which effectively pushes Treasury bond yields higher, raising borrowing costs for businesses and homebuyers. Along with the expectation of Fed rate hikes, these actions could keep both short-term and long-term interest rates higher for longer.
For long-term investors, this means it’s more important than ever to hold a thoughtful balance of stocks, bonds, and other assets that are designed to achieve financial goals.
The bottom line? Real yields are at their highest levels in years, driven by inflation concerns, fiscal uncertainty, and a shrinking Fed balance sheet. A thoughtfully constructed and well-balanced portfolio aligned with financial plans is more important than ever.
2. https://gasprices.aaa.com/
3. https://www.jec.senate.gov/public/index.cfm/republicans/debt-dashboard
4. Clearnomics research and LSEG data as of July 27, 2026
5. https://www.federalreserve.gov/monetarypolicy/task-forces.htm
Historical references do not assume that any prior market behavior will be duplicated. Past performance does not indicate future results. This material has been prepared by Kingsview Wealth Management, LLC. It is not, and should not, be regarded as investment advice or as a recommendation regarding any particular security or course of action. Opinions expressed herein are current opinions as of the date appearing in this material only. All investments entail risks. There is no guarantee that investment strategies will achieve the desired results under all market conditions and each investor should evaluate their ability to invest for the long term. Investment advisory services offered through Kingsview Wealth Management, LLC (“KWM”), an SEC Registered Investment Adviser. (2025)
The illustrations, charts, and other visual materials included in this marketing material are provided by third-party sources. These illustrations are for informational purposes only and do not represent the actual performance of any specific investment, product, or strategy. The third-party information presented herein has been obtained from sources believed to be reliable; however, Kingsview Wealth Management makes no warranty or representation, expressed or implied, as to its accuracy or completeness. The inclusion of this material does not imply an endorsement of any third-party content, nor should it be construed as financial advice.